Chart Patterns Trading
In this lesson, we will focus on technical patterns.
Chart Patterns Trading
Now that we have covered horizontal and diagonal support and resistance, we can look at chart patterns as they are a combination of both. Chart patterns are one of the oldest parts of technical analysis and price action trading. They were proven many times as a functional way to help technical traders identify the next market direction. That being said, a trader should not forget about the context and current market conditions while making decisions in trading.
Head and shoulders pattern
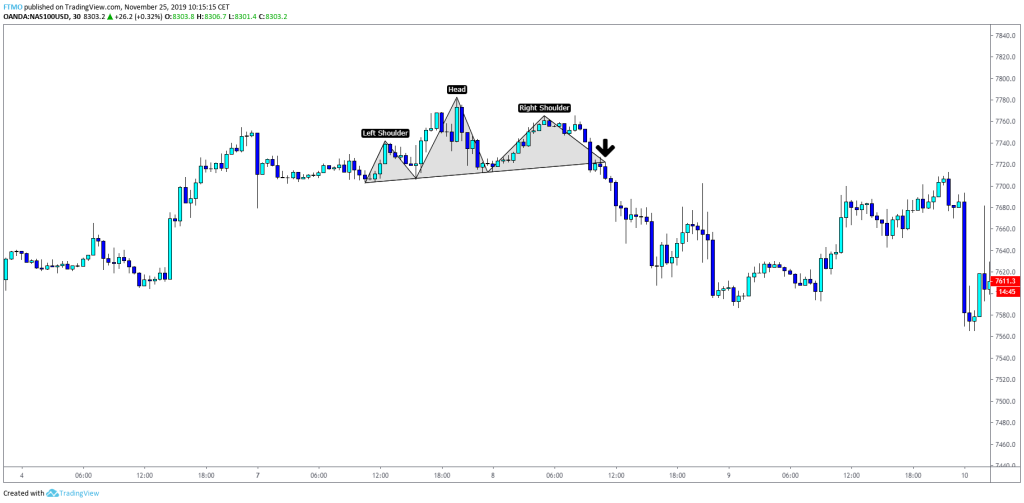
The Head and shoulders pattern is believed to be one of the most reliable reversal patterns. It starts after a long bullish trend when the price rises to the peak and pulls back. Shortly after, the price rises again to a significantly higher peak but declines again. Finally, the price goes up for the third time but only reaches a level of the first high. After that, it pulls back and completes the pattern, which signals that an uptrend is ending and the price is about to decline. The first and third peaks are the shoulders, and the second peak is the head. The support level where the price bounces from is called a neckline and is often used as entry-level on a break.
Inverse head and shoulders pattern
As with other patterns, there is also an inverse head and shoulders, which occurs after an extended downtrend and indicates that price will go up.
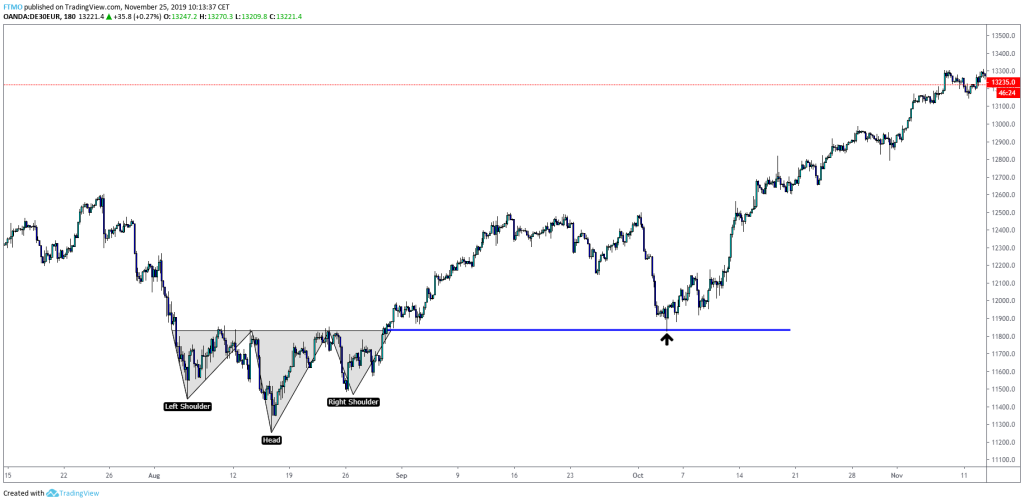
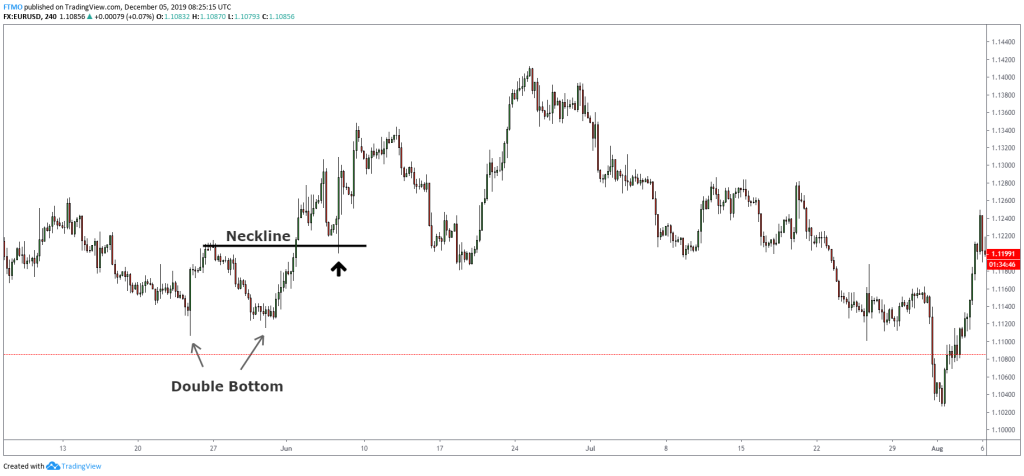
We can notice on both charts that breaking off a neckline would give us a great trading opportunity. In the second case, we could even use a neckline retest as a second entry.
Cup and handle patterns
A cup and handle pattern is a bullish continuation pattern. It consists of two parts – a cup and a handle. Once a cup is completed, the handle is formed on the right side of it. If it is followed by a breakout on a resistance line and traders consider it a signal for an uptrend. The pattern can only be recognized on the long term charts because of the longer time requirement of forming a pattern.
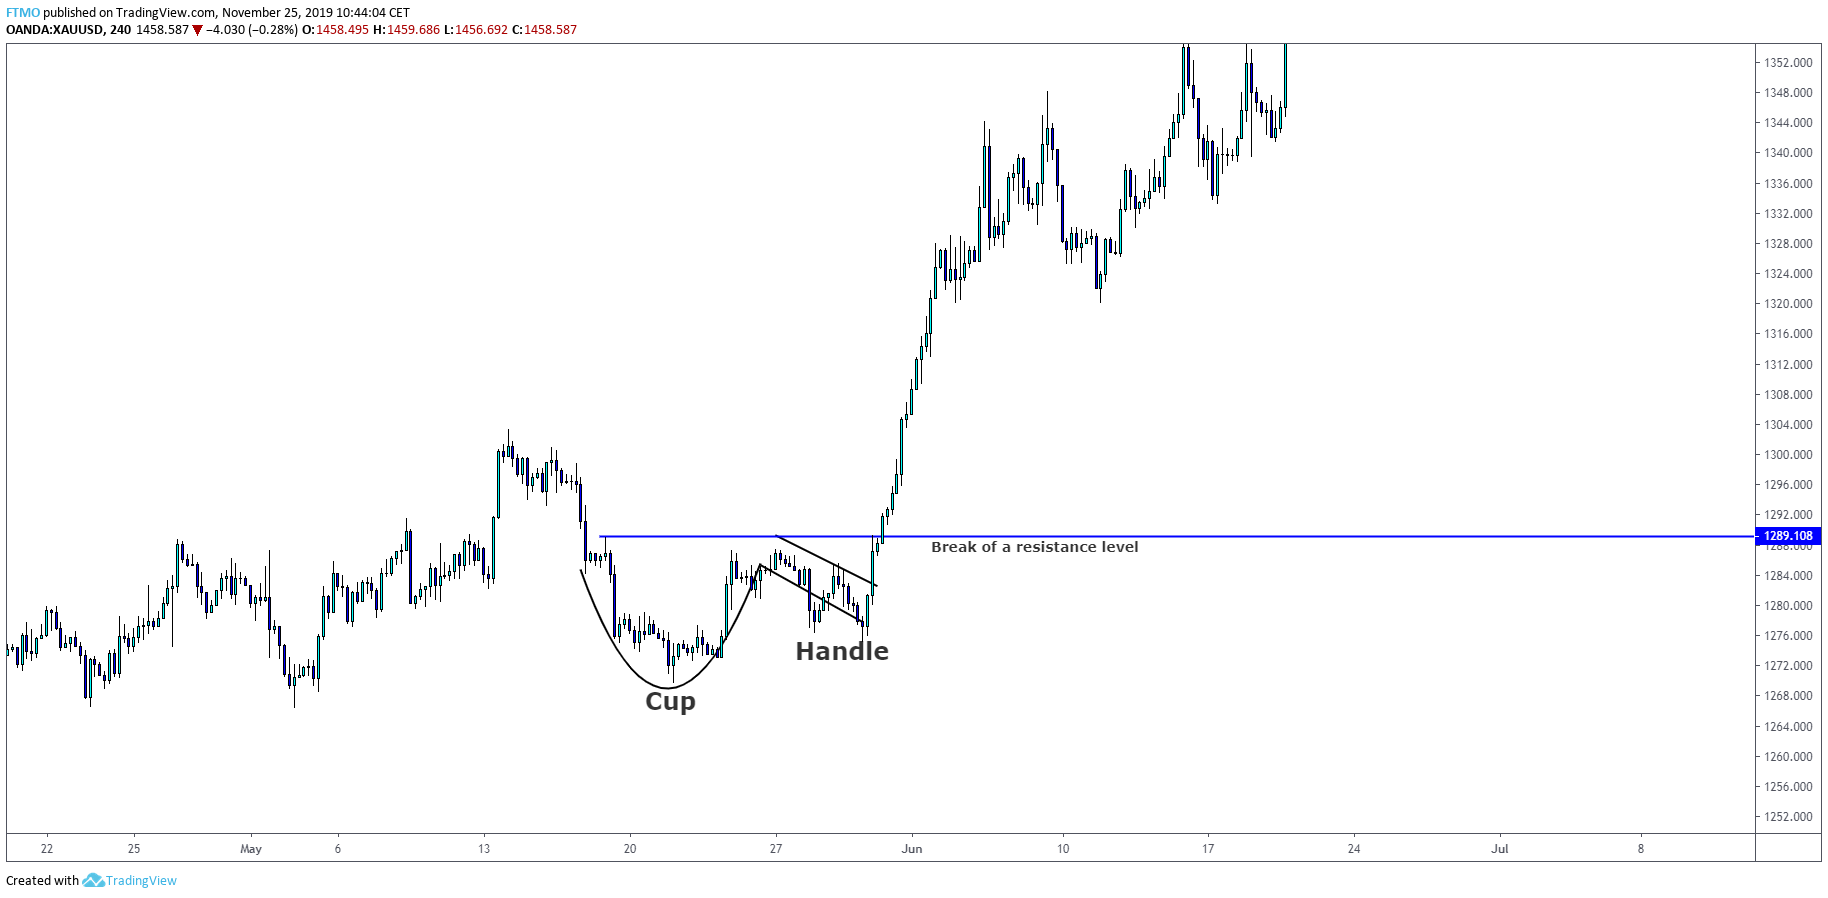

As we can see, identifying and trading a ‘cup and handle’ pattern is nothing complicated. Once we enter the trade on a retest of resistance, we can place our stop loss below the low of a handle and let the trade do its work.
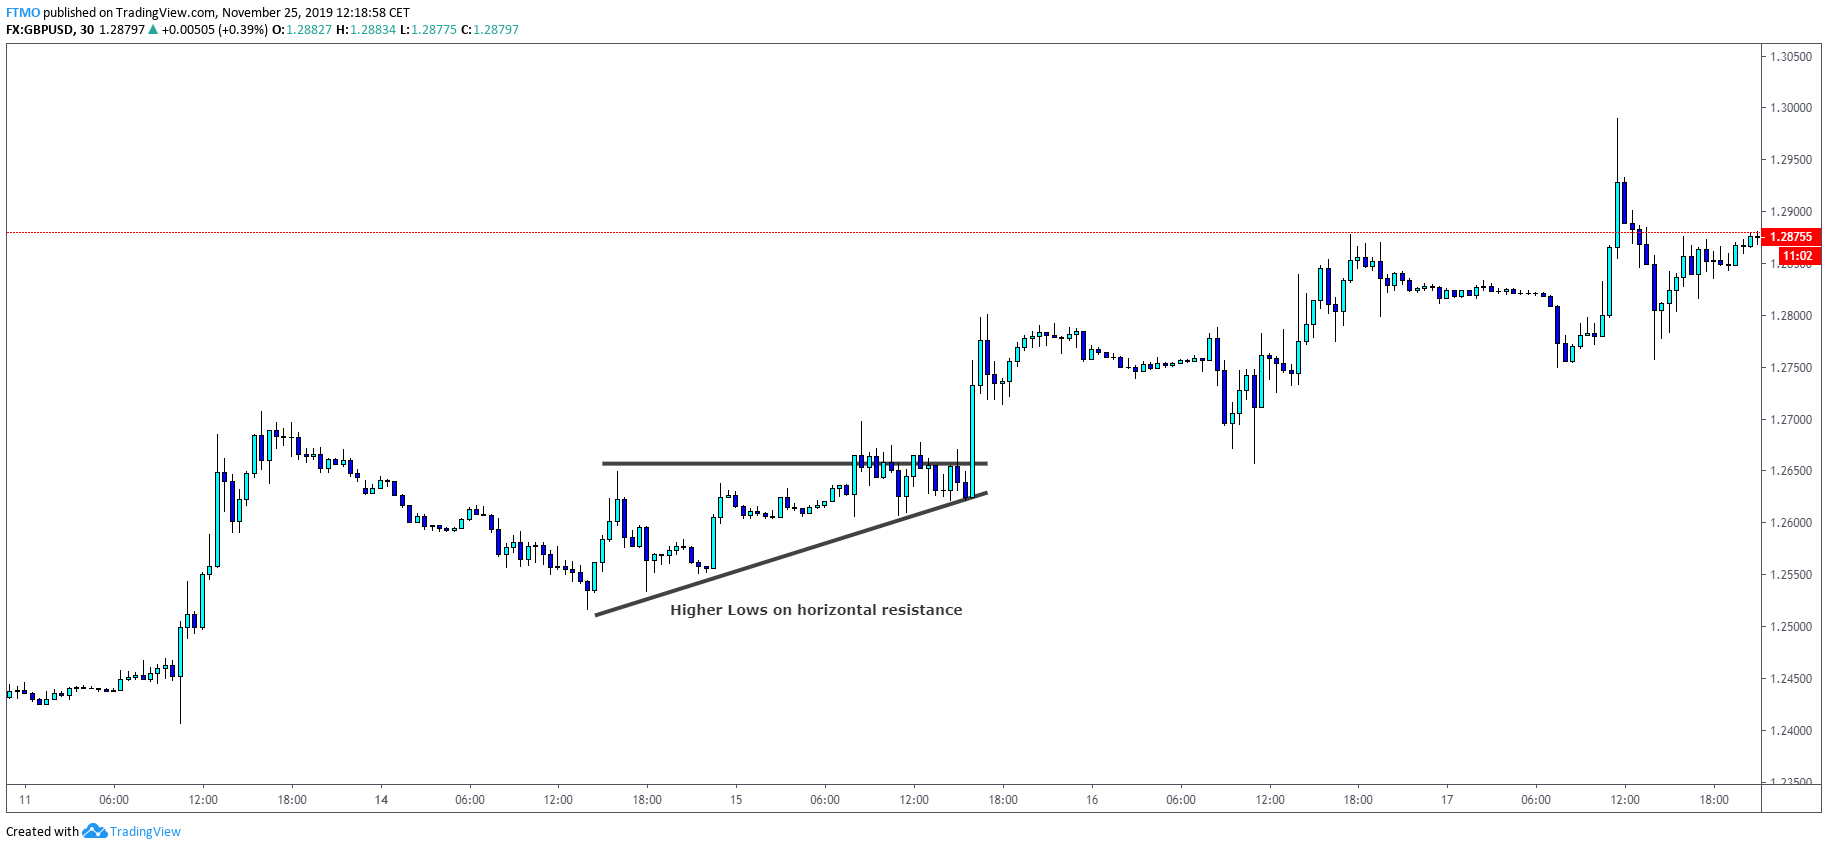
Ascending triangle
Both ascending and descending triangles are one of the most popular patterns among traders. To really help us understand this pattern, we should take a look at it from more of a logical perspective. The ascending triangle is formed when the price is unable to break a resistance but at the same time, it is forming higher lows.
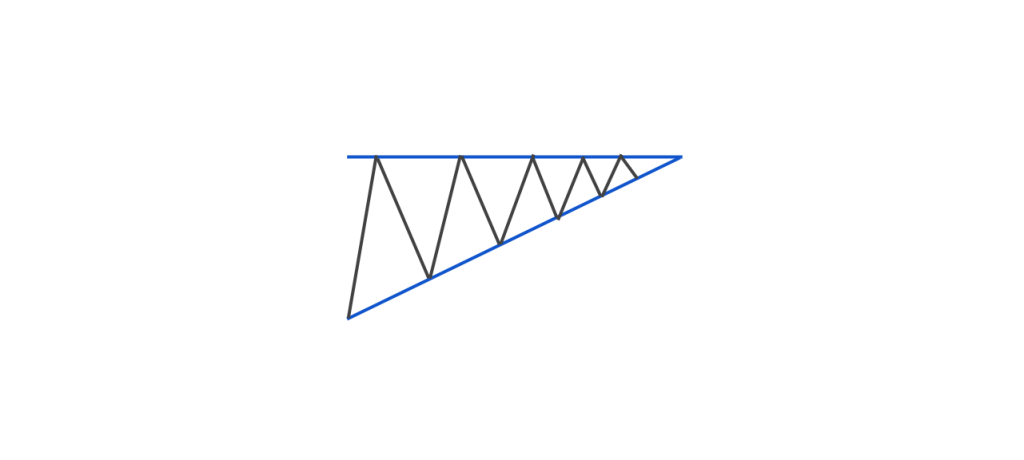
As we may notice in the example above, the price is bouncing from resistance but is unable to make a lower low on each bounce. This is giving us a bullish signal that a possible break is about to happen.
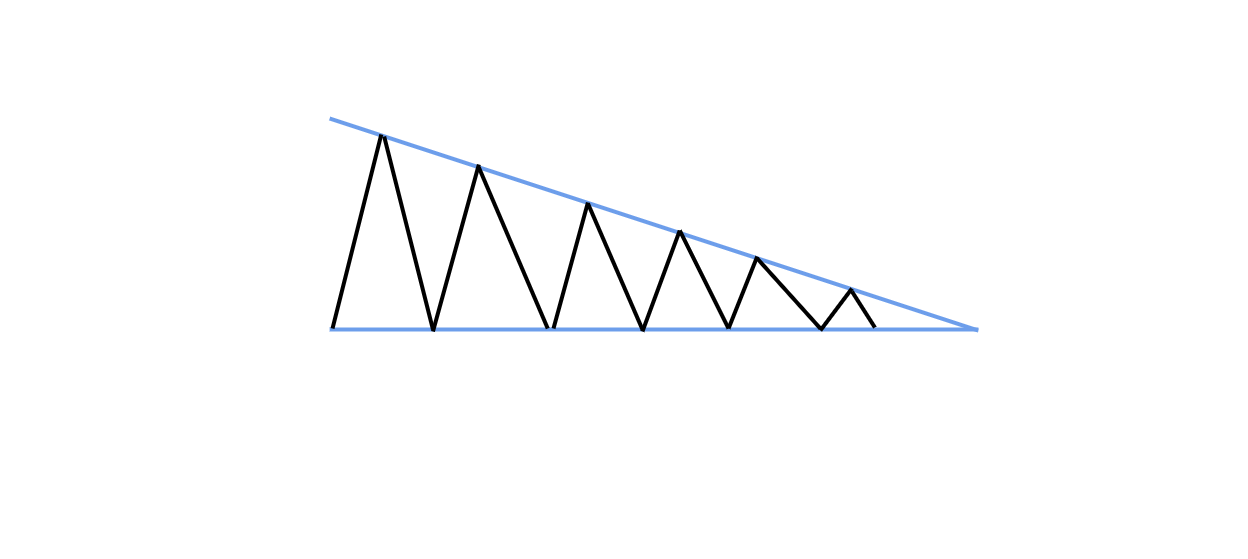
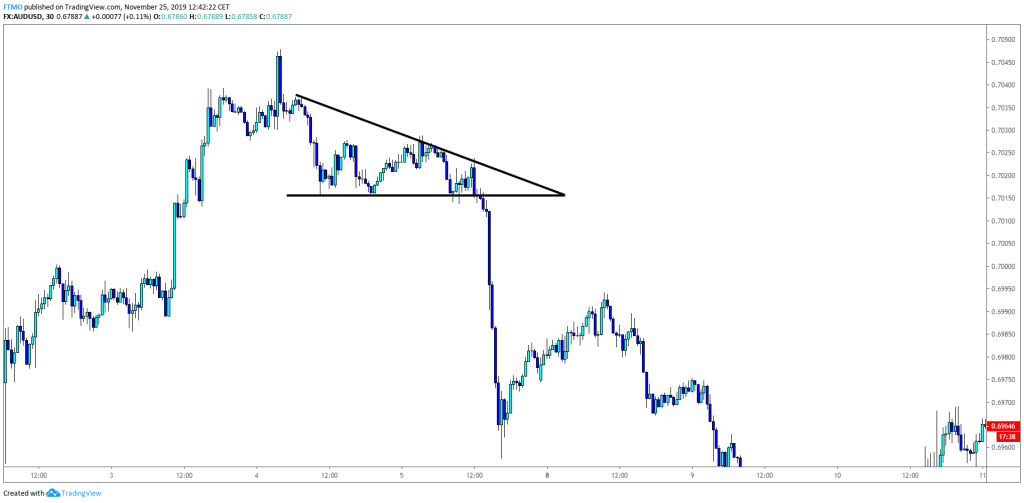
Descending triangle
Inverse to the ascending triangle, the descending triangle is visible when the market is bouncing from support but it is unable to make higher highs.
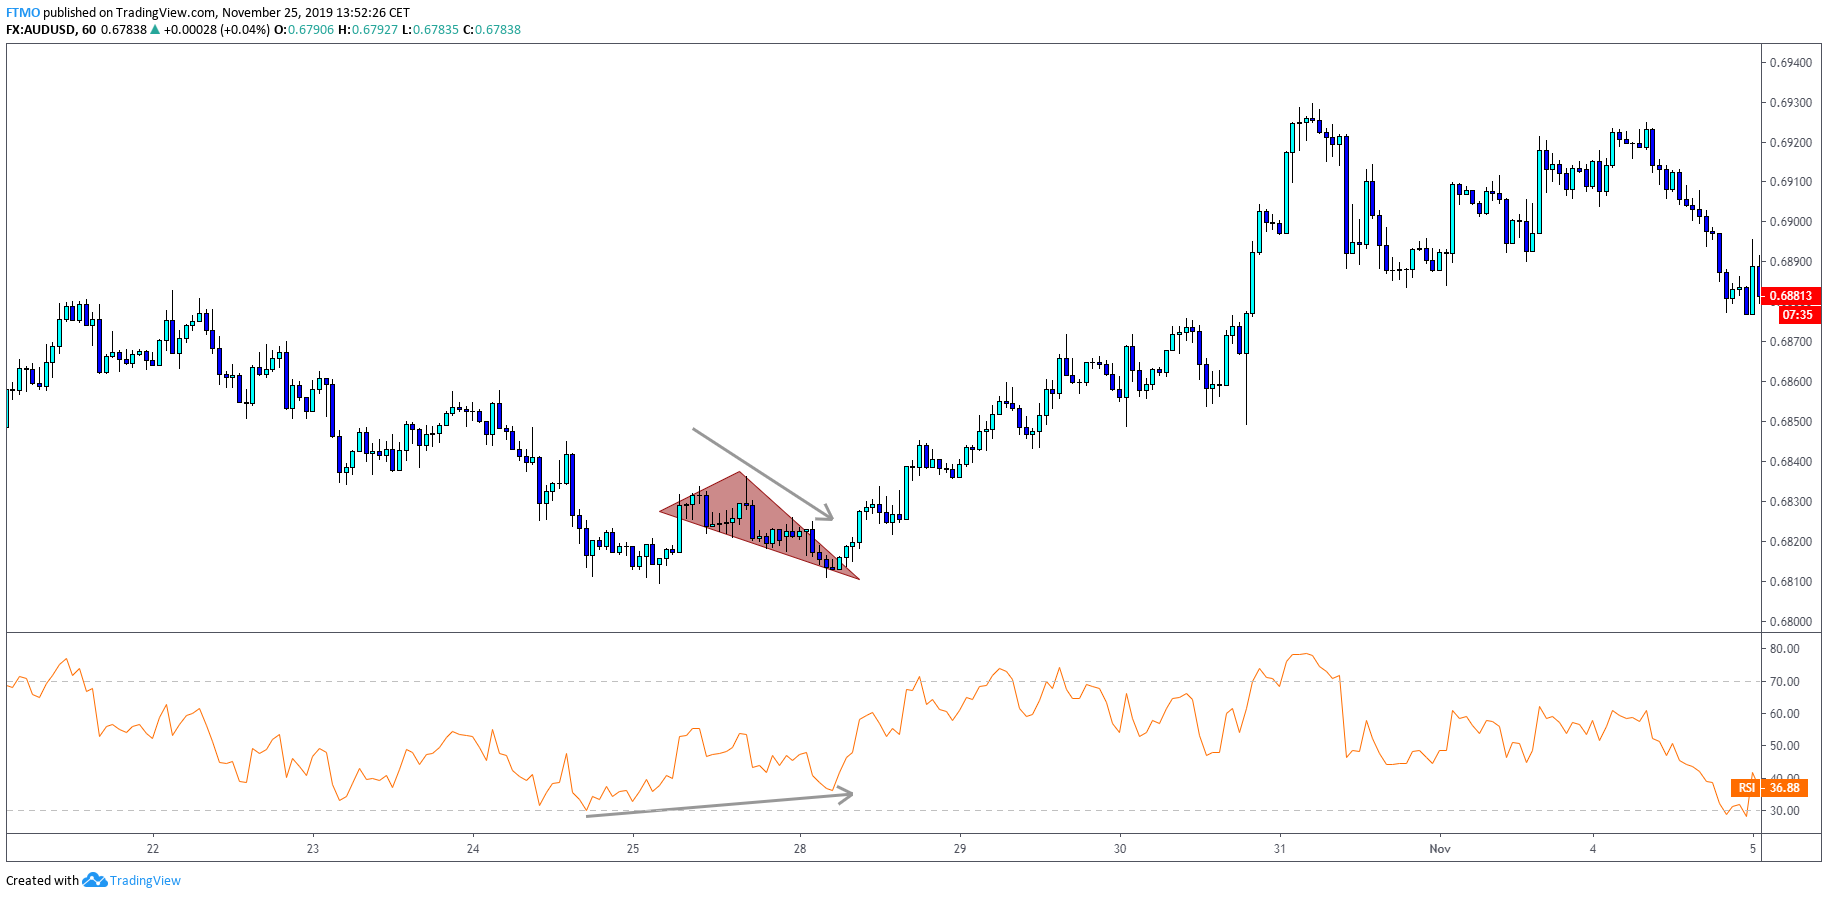
Falling wedge
A falling wedge is a bullish reversal pattern which happens most of the time when the price is pushing lower but we can see divergence at one of our oscillators. This means that even if the price is going lower, sellers are getting exhausted and we can expect a reversal to happen soon.
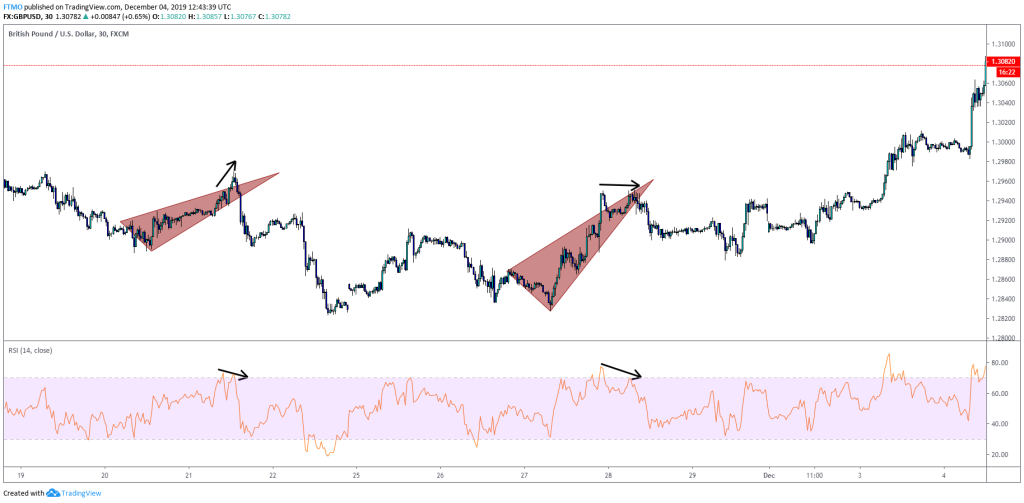
Rising wedge
Reversal of falling wedge, the price is pushing higher, but we can find weakening clues in our oscillator.
Double top pattern
The double top pattern is usually made as a topping formation at the end of the trends. It is a bearish reversal pattern which is characterized by the peak which is shortly followed by the second one at the same or very similar price point. Once the price breaks the support made below the highs, the double top pattern is valid. We use the same term “neckline” which is also used with the head and shoulders pattern. We can either enter the trade once the neckline is broken or wait for the retest of the neckline.

Double bottom pattern
The opposite of the double top is the double bottom pattern which is made at the bottom of the downtrend. The double bottom is characterized as two bottoms at an equal or similar price level. Same as with the double top pattern, we can enter either at the break of the “neckline” or its retest.
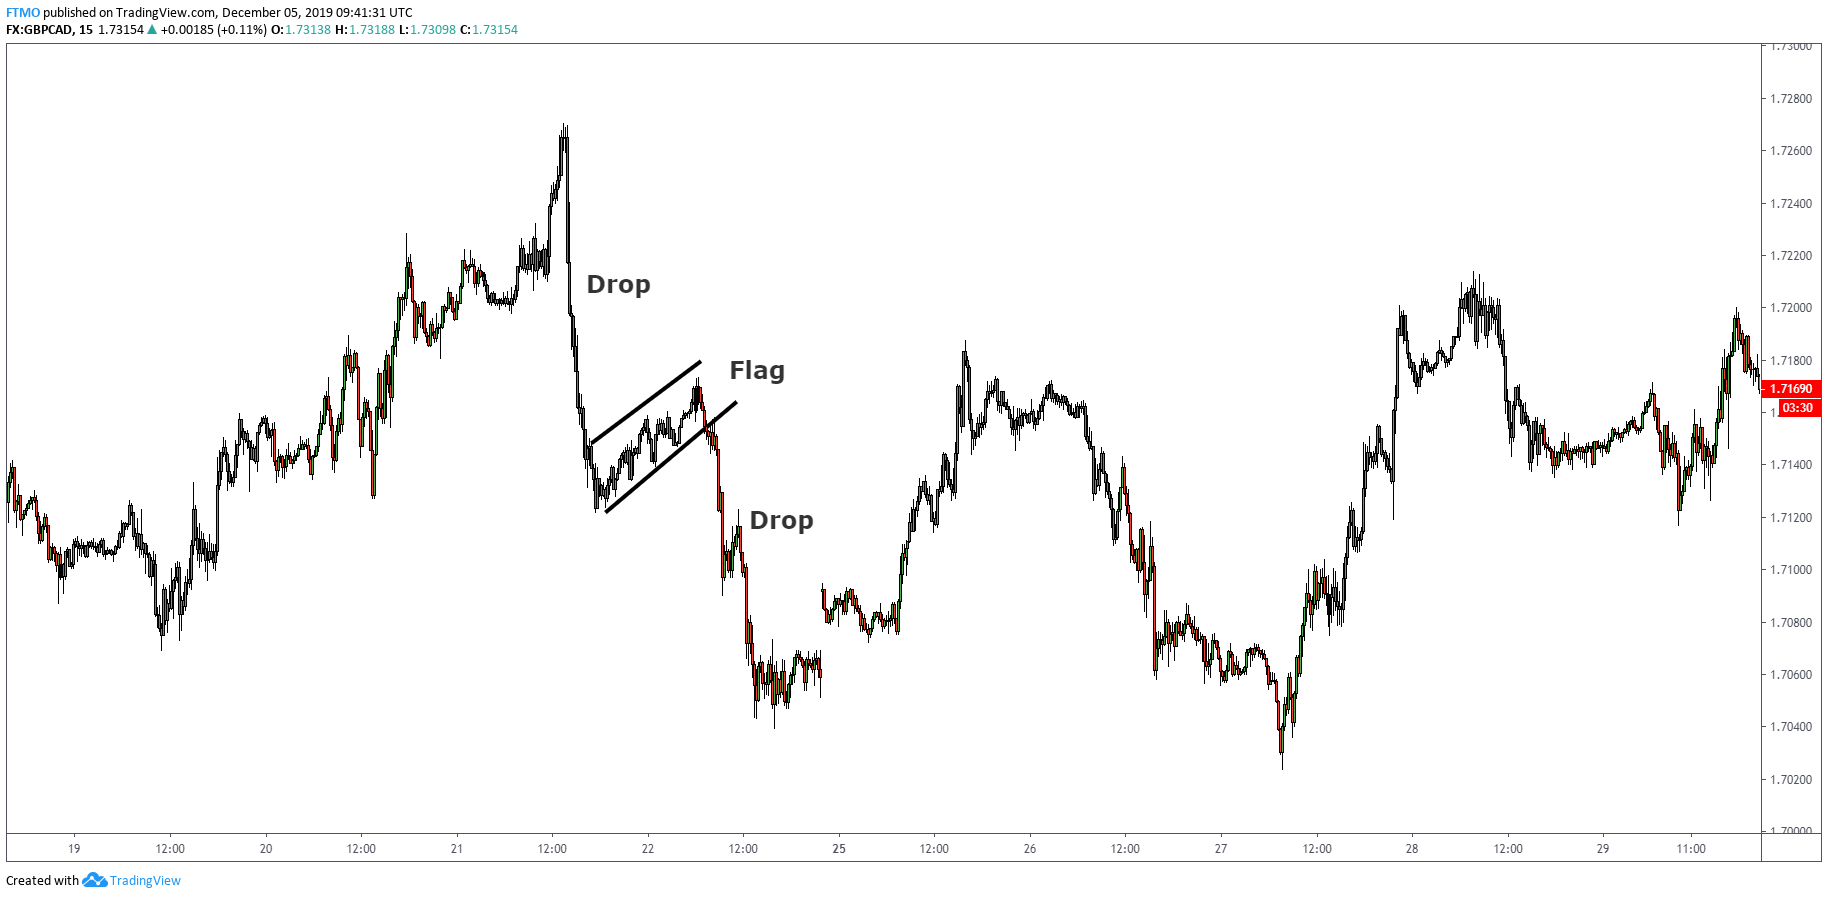
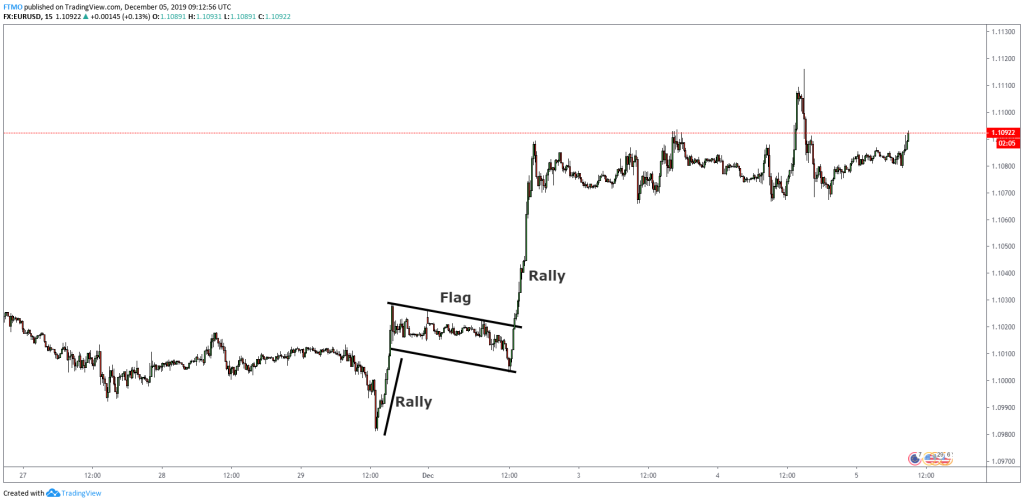
Flags
Flags are technical patterns which can be understood as a pause in the underlying trend. Flags are spotted as consolidation after a fast trend in the market and they signal the continuation after the breakout. As with all chart patterns, we have a bull and bear flag.
Bull flag
Bear flag