


cTrader Guide
We’ll repeat it again, but the choice of a platform Is a very important step for every trader. Everyone is suited for something different and each of us has different preferences.
In the third part of this section we will take a look at the cTrader platform. It is a state-of-the-art platform, and, according to many traders, this is evident at a glance when comparing it to MT4 and MT5. It is a popular alternative to the MT4 and MT5 platforms, but for traders used to MetaTrader the environment may seem a little bit confusing. Compared to MetaTrader, cTrader contains many features and tweaks already in the basic setup and there is no need to download them from the Internet.
cTrader on PC
cTrader offers modern user interface with chart settings, advanced backtesting and also trading tools and much more.
Login
After downloading and installing the platform, the first time you open the cTrader, you have a login to your demo or real account. You will do it with cTrader ID and password, which you will find in the FTMO Client Area.
Workspace
When you log in to the cTrader software, you will see the default workspace. In the layout tab, you can control the surroundings panels around your chart. If you want to save your changed workspace, just click on My Workspace and save it.
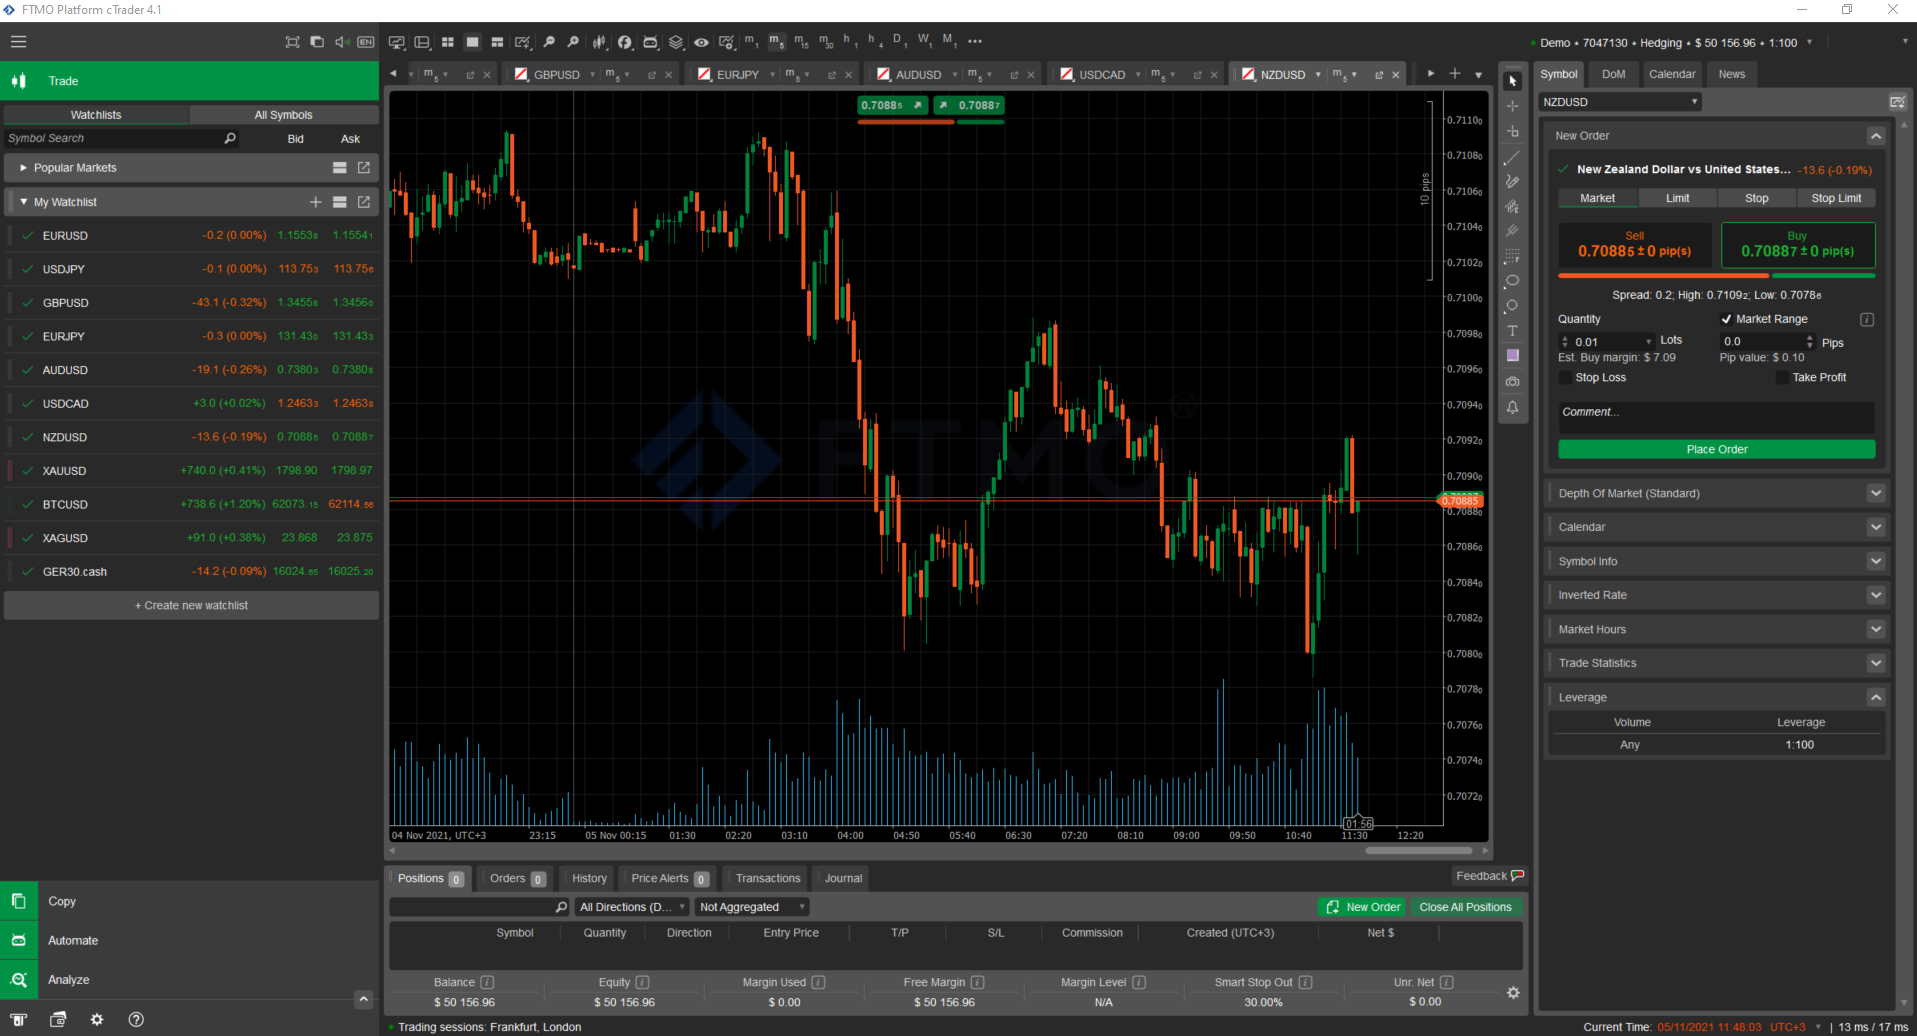
Watchlist
On the left, you have a window with the Watchlist, which has all the popular instruments. If you want to create your own watchlist, click on Create a New Watchlist and modify it as you want it. If you want to see the chosen instrument in the chart, just drag it into the centre of the workspace, where all the charts of a chosen instrument are or just right-click on it, and select New Chart.
Next to the Watchlist is the All Symbols tab where you can see all the instruments that you can trade. There are many more instruments to trade, like majors, minors, cryptocurrencies, indices, CFDs, commodities etc.
Trade Watch
Below the chart is the Trade Watch, where you see your open positions, pending orders, history of closed orders, defined price alerts, your transactions history, and your notes in the journal. In the first four tabs you can also see the account stats.
Active symbol panel
In the active symbol panel, you can learn information about chosen instruments such as Bid and Ask spread, depth of the market, current news events, symbol information, market hours, and trading history. At the top of the symbol panel, you can also open new positions.
Open a trade
If you go to the Watchlist and right-click on the instrument you want to trade, a window will appear where you can choose a “Create New Order” option. In the new window, you will see your Bid and Ask prices for selling or buying an instrument for opening short or long trades.
First, you have to decide if you want to open a market order, a limit order, a stop order, or a stop-limit order. Then you can choose if you are going long or short and set the volume of the specific instrument measured in lots. Below the quantity, you can set your limits on the order.
Here you can set your Stop Loss and Take Profit for closing your trade. You can also add some comments there. You can also use the chart on the right to quickly drag and drop your Stop Loss and Take Profit and see your potential loss and profit. This feature is very useful in quick decision-making, and it is something that MetaTrader does not offer.
If you want to open a trade with just one click, just click anywhere in the chart to allow this feature to work, and then place a buy or a sell trade. You can modify the settings of the One-Click order in the settings found in the Quick Trade tab.
Trailing stop
If the price moves in the desired direction and you want to automatically shift your Stop Loss to a higher level, just right-click on your position in the trade, select Stop Loss, and set the Trailing Stop below.
Another tool for this is the small shield icon for the advanced Stop Loss and Take Profit orders. If you left-click on it, you can set up scale-out Take Profits, and automatic Break Evens. Bear in mind that this advanced feature only works when your cTrader is turned on.
Close a trade
To close a trade, you have to go to the Trade Watch where you have your position, right-click on it, and close it. If you want to close just some volume of your position, double left-click on it and specify the amount you want to close. You can also press the small x button on the right side of the position.
You might have noticed two additional buttons between the X and the shield button. The double arrow will double your existing position, and the u-turn icon will immediately close your positions and open one in the opposite direction. These buttons can sometimes cause more bad than good, so be careful when you are using them.
Technical Indicator
To apply an indicator, go to the Indicator icon. Simply select the indicator, and the window will appear, and you will choose desired settings. When you modify the settings of the indicator, click OK, and it is done. If you want to remove it, right-click on it and choose to delete it in the upper right corner.
Chart window and modification
The drawing and windows toolbar is on the right side next to the chart. There you can adjust your windows, add different lines, text, and so on. You can change the timeframes on the left side, save your template, manage your indicators, and change the chart visualisation. If you click on time periodicity next to the symbol name, you can change your chart type based on time, ticks, range or renko charts. In the main menu on the left, there are also options for copy trading, algo trading, trade analytics and settings.
cTrader on Android
The popularity of trading and managing accounts via mobile phones has been growing rapidly in recent years. This is certainly no exception with cTrader, although some traders say that it is not the most convenient way to analyse trades.
Login
Once you open the cTrader platform, you will be asked to log in. You do it by filling in the email you used for the FTMO registration.
Menu
The home screen has six different tabs, which you change by swiping left and right. You have two options below, the main one is called Trade, and the second one is called Blotter, and it displays all new economic events.
The menu can be accessed by pressing the menu button in the upper left corner. You can make a new order, create a price alert, find and add symbols, open settings, sign out or switch between different accounts.
Watchlists
If you click on the Watchlists tab, you can create different watchlists and open new positions. New watchlists can be created by clicking on the small arrow button, and new symbols can be edited when you scroll down and click on add symbols. Existing symbols can be modified by clicking on the pencil button. In this tab, you can create different watchlists and also open new positions.
Positions
In the positions tab, you can see your currently opened trades. If you press the new trade button on the lower right side, you can quickly open a new trade. The newly opened trade is in the positions tab, where you can modify it by closing partial profits, setting Stop Losses, and Take Profits. You can also open the chart for a given instrument and see the details of the instruments.
Order
The next tab shows your pending orders. If you create a new buy limit order and create it below the market, you can see it in the orders tab.
Price alerts
The price alerts allow you to see your active price alerts and create new ones. If you press the plus button on the lower right side, you can create a new price alert.
History
The History tab shows your profits and losses (P&L) from all your executed trades. If you scroll down, you can see realised P&L of your whole account. You can click on each trade to show details.
Transactions
The transactions tab shows deposits and withdrawals on your trading account.
Charts
If you go to the Watchlist tab after you click on the instrument of your choice, you can see the quick execution bar chart, market sentiments, depth of market, economic calendar, instruments specs, market hours, and your trading statistics.
If you enlarge the chart, you can use the bottom bar for changing time-frames, different chart visualisations, adding indicators, drawing tools, and making new orders.
cTrader on the iPhone
Login
Once you open the cTrader platform, you will be asked to log in. Similar to the Android version, you can fill in the email you used for the FTMO registration in the iPhone version of the platform.
Menu
The home screen of the platform on iPhone has seven different tabs, which you change by swiping left and right. The first tab can be accessed by pressing the menu button in the upper left corner. There you can make a new order, create a price alert, find and add symbols, open settings, sign out or switch between different accounts.
Popular markets
If you swipe to the next tab, you will see the popular markets. In this tab, you can create different watchlists and also open new positions.
New watchlists can be created by clicking the plus button, and new symbols can be edited when you scroll down and click on Add Symbols. Existing instruments can be modified by clicking the Pencil button. In this tab, you can create different watchlists and also open new positions.
Positions
In the Positions tab, you can see your currently open trades. If you press the new trade button on the upper right side, you can quickly open a new trade. The newly open trade is now in the Positions tab, where you can modify it by closing partial profits, setting Stop Losses and Take Profits. You can also open the chart for a given instrument and see the details of the instruments.
Order
The next tab shows your pending orders. If you create a new buy limit order and create it below the market value, you can see it in the Orders tab.
Price alerts
The Price Alerts allow you to see your active price alerts and create new ones. If you press the Price Alert button in the upper right corner, you can create a new price alert.
History
The History tab shows your profits and losses (P&L) from all your executed trades. If you scroll down, you can see all realised P&L of your whole account. You can click on each trade to show detail.
Transactions
The transactions tab shows deposits and withdrawals on your trading account.
Charts
If you go to the Popular Markets tab after you click on the instrument of your choice, you can see the quick execution bar charts, market sentiments, depth of the market, economic calendar, instruments specs, market hours and your trading statistics. If you maximize the chart, you can use the bottom bar for changing time frames, different chart visualisation, adding indicators, drawing tools and making a new order.
