


Divergence trading
In this lesson, we will cover divergence trading.
What is divergence trading?
Divergence trading is a technique for identifying potential market reversals by comparing price action with oscillators like RSI or MACD. When the price reaches higher highs or lower lows that aren’t mirrored by the oscillator, it indicates a divergence, signalling a possible trend change.
Many traders struggle to predict market reversals, as prices don’t always follow simple patterns. That’s where divergence trading can help. There is a popular saying in trading that all we have to do to be profitable is to buy low and sell high. Unfortunately, in real trading, things are rarely easy like that. Although we will hardly sell the absolute top or buy the absolute bottom, we can use divergences to spot possible reversals very early and also use them to manage our existing positions.
In this lesson, we will take a closer look at what is divergence in trading and how to work with it.
Divergence in Trading: Identifying Trends with Indicators
The divergence can be spotted by comparing price action with different oscillators. When the market is going up, and the price is making a higher high or going down, the price makes a lower low, the indicator should also make higher highs and lower lows. But when there is a divergence, we can see that an uptrend price is making higher highs, and the indicator is making lower lows. Same for a downtrend, the price is making lower lows, but the indicator is making higher highs. It is up to us what indicator we decide to use.
The most popular ones are RSI, MACD or Stochastics.
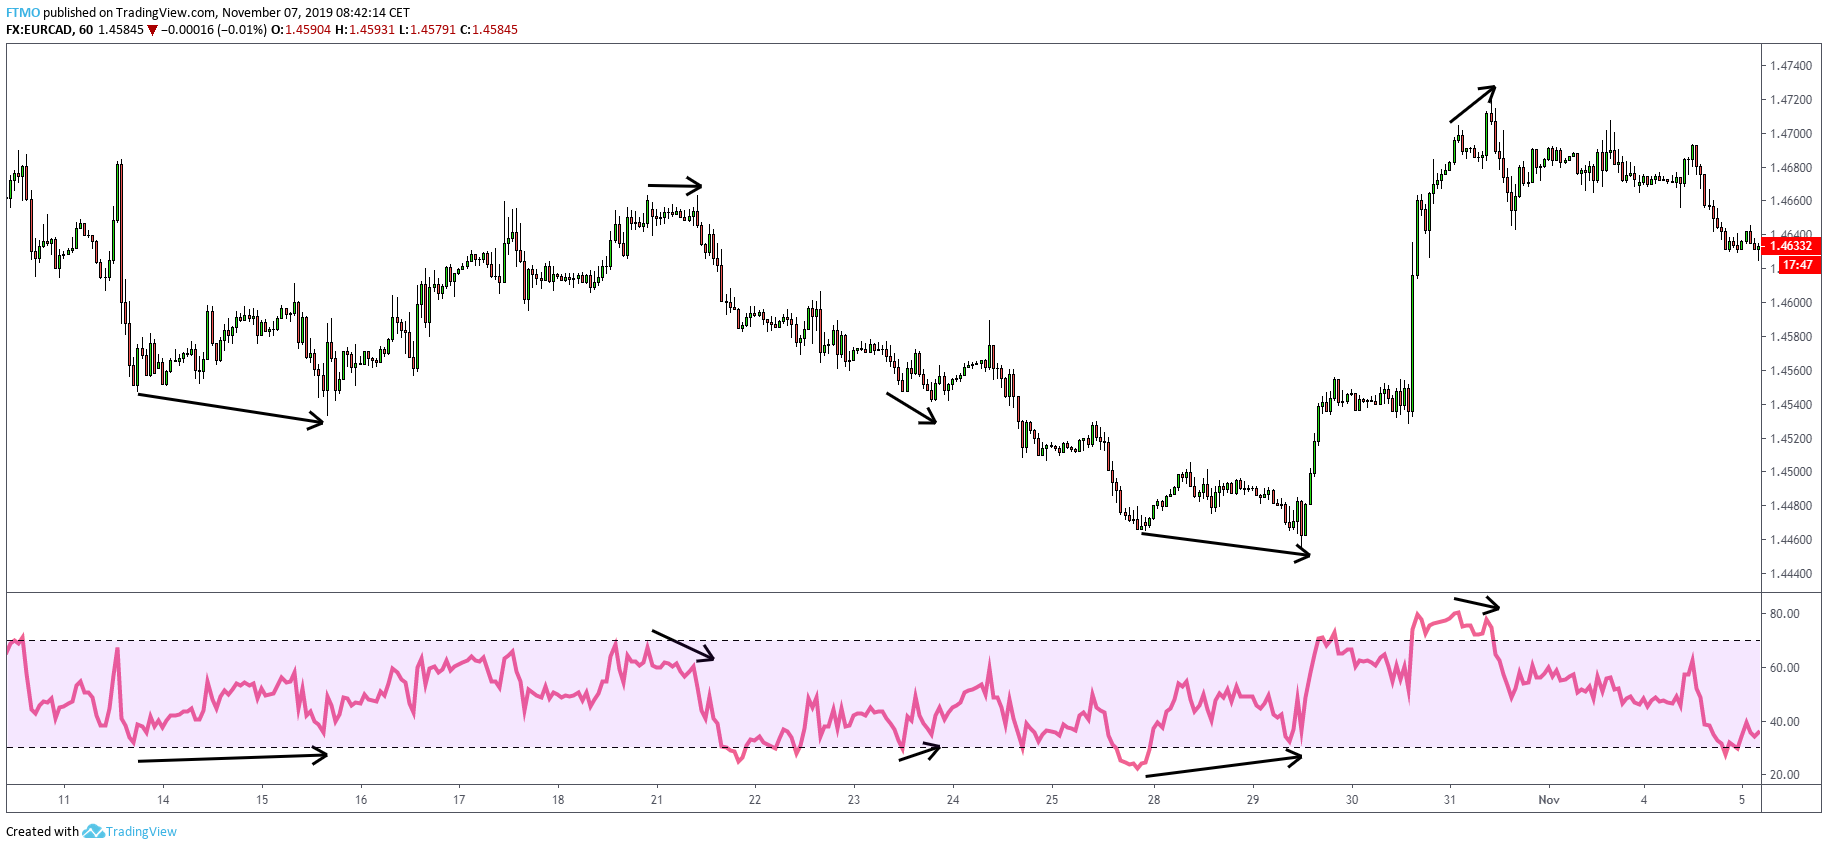
Compared to indicators such as moving averages or Bollinger Bands which are lagging indicators, divergences are considered a leading indicator. This means that we can catch reversals near-absolute tops and bottoms and get great Reward-to-Risk Ratio setups.
Sounds great, right?
It is great, but like anything in trading, divergence trading is not some hidden secret to the markets. We will often find out that divergences appear in strong trends, but the price is still going in one direction. This is why divergences are best to use once the market slows down after a strong directional move where we can spot a weakening momentum. There are two types of divergence: Regular and hidden.
Regular divergence
Regular divergences are used for possible trend reversals. There is a bullish and bearish regular divergence.
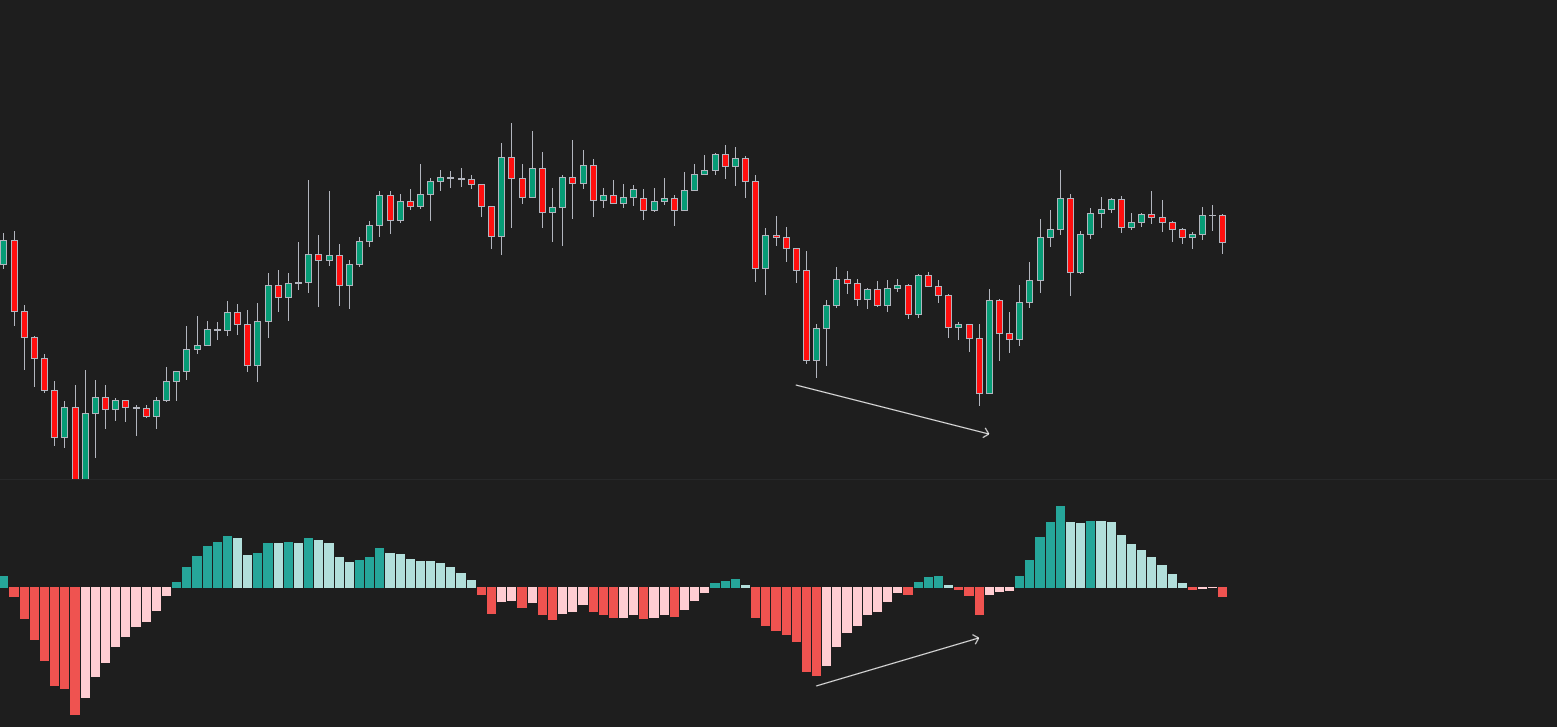
What is a bullish divergence? The bullish divergence can be spotted when the price makes lower lows, but the oscillator makes higher lows. This can be a possible signal of a downtrend reversal. As we can see in the example, a price makes lower lows that are not confirmed on the MACD indicator; therefore, we can look for a trend reversal.
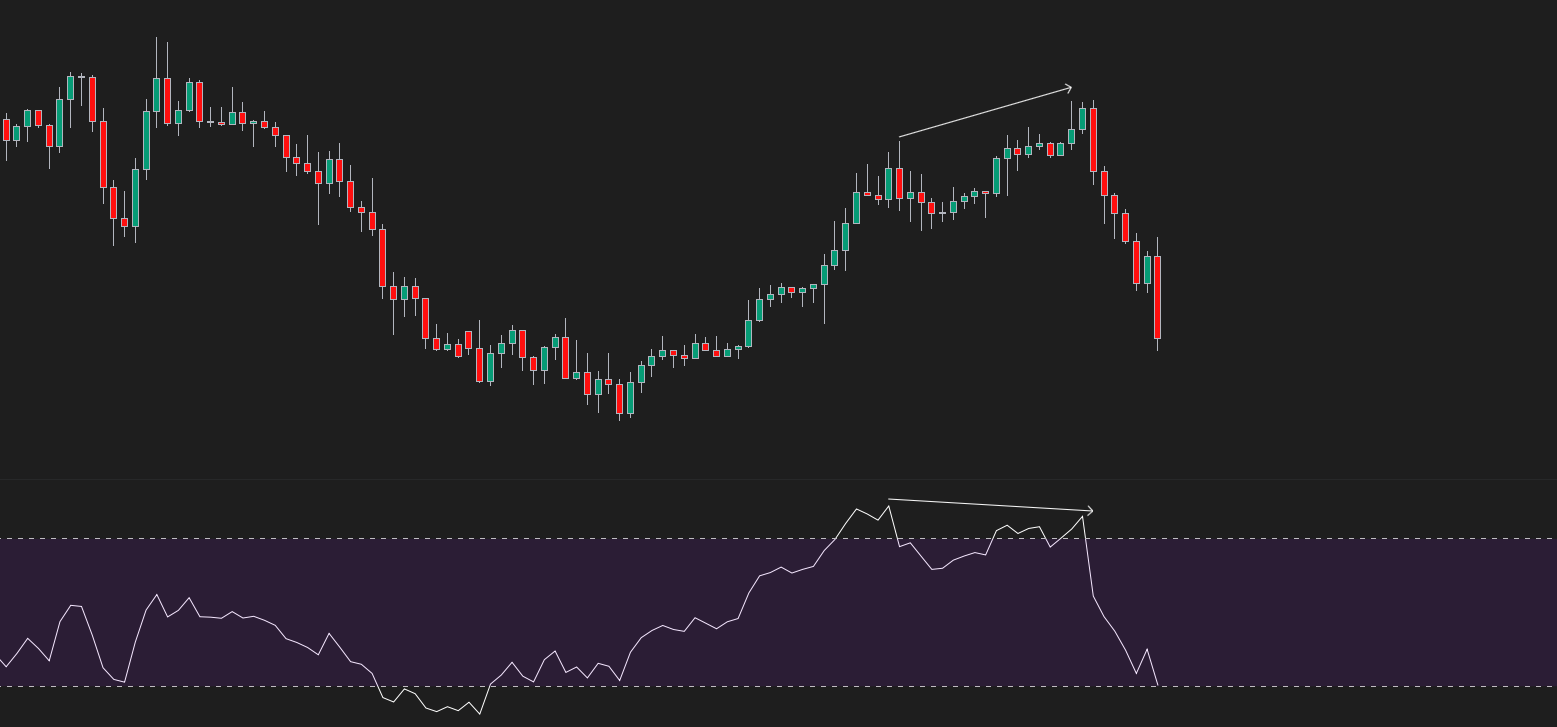
Opposite to that is a regular bearish divergence. When the price is making higher highs, but the oscillator makes lower highs, we can spot the regular bearish divergence. This can be a signal of a reversal in an uptrend. As we can see in the example, a new high in price is not represented by a new high in the oscillator, in this case, the RSI.
After spotting a regular divergence, we don’t need to always jump right in the trade. More often than not, the better choice is to wait for other confirmations like watching a price action or technical indicators.
What is a hidden divergence?
Compared to regular divergences, hidden divergence can signal possible trend reversals and a trend continuation. As trend trading can oftentimes be easier than trying to catch tops and bottoms, hidden divergence is a useful tool we can use. A hidden bullish divergence can be found in an uptrend.
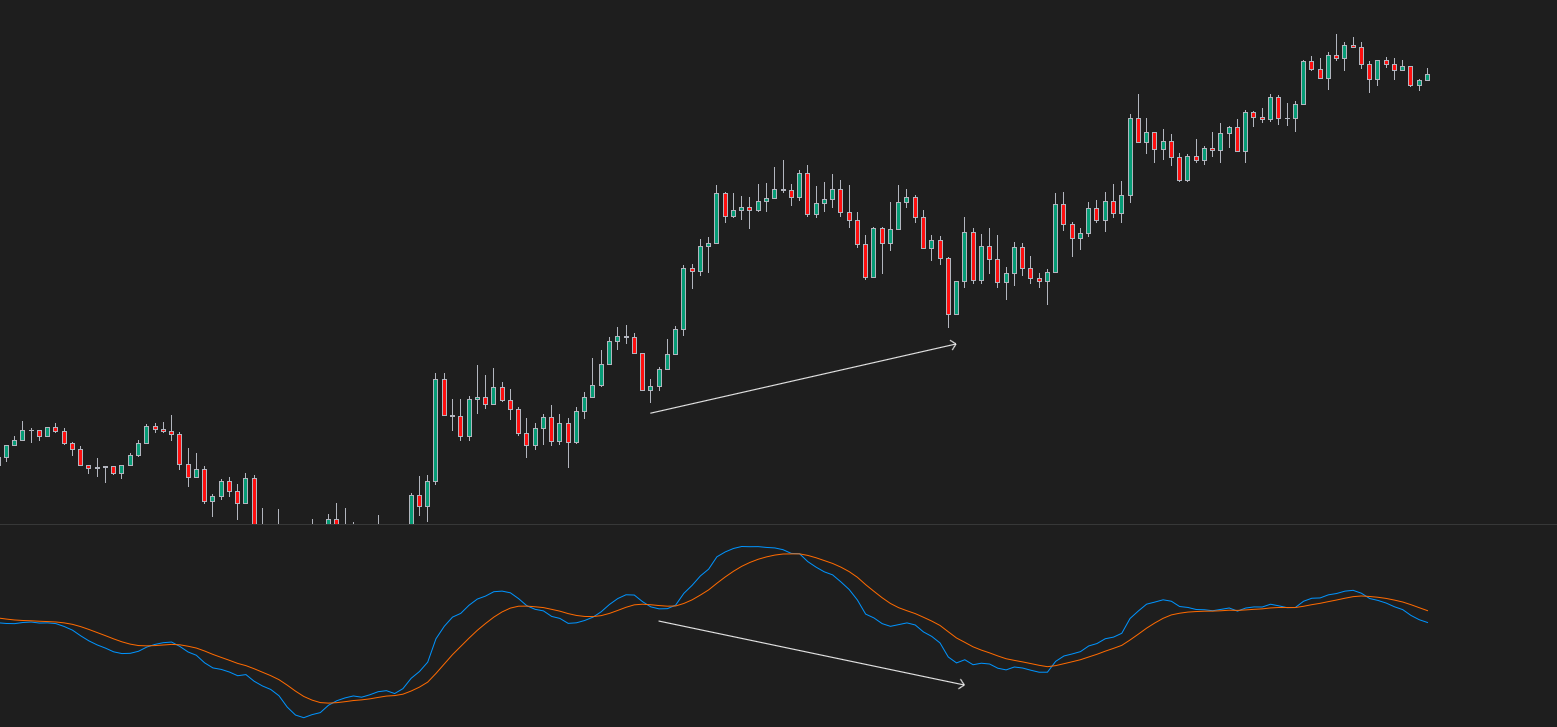
We can spot a hidden bullish divergence when the price makes a higher low and the oscillator makes a lower low. Hidden bearish divergence is presented when the price makes a lower high and the oscillator makes a higher high. Here is the recap of what we learned in today’s lesson, as we can see on the table.
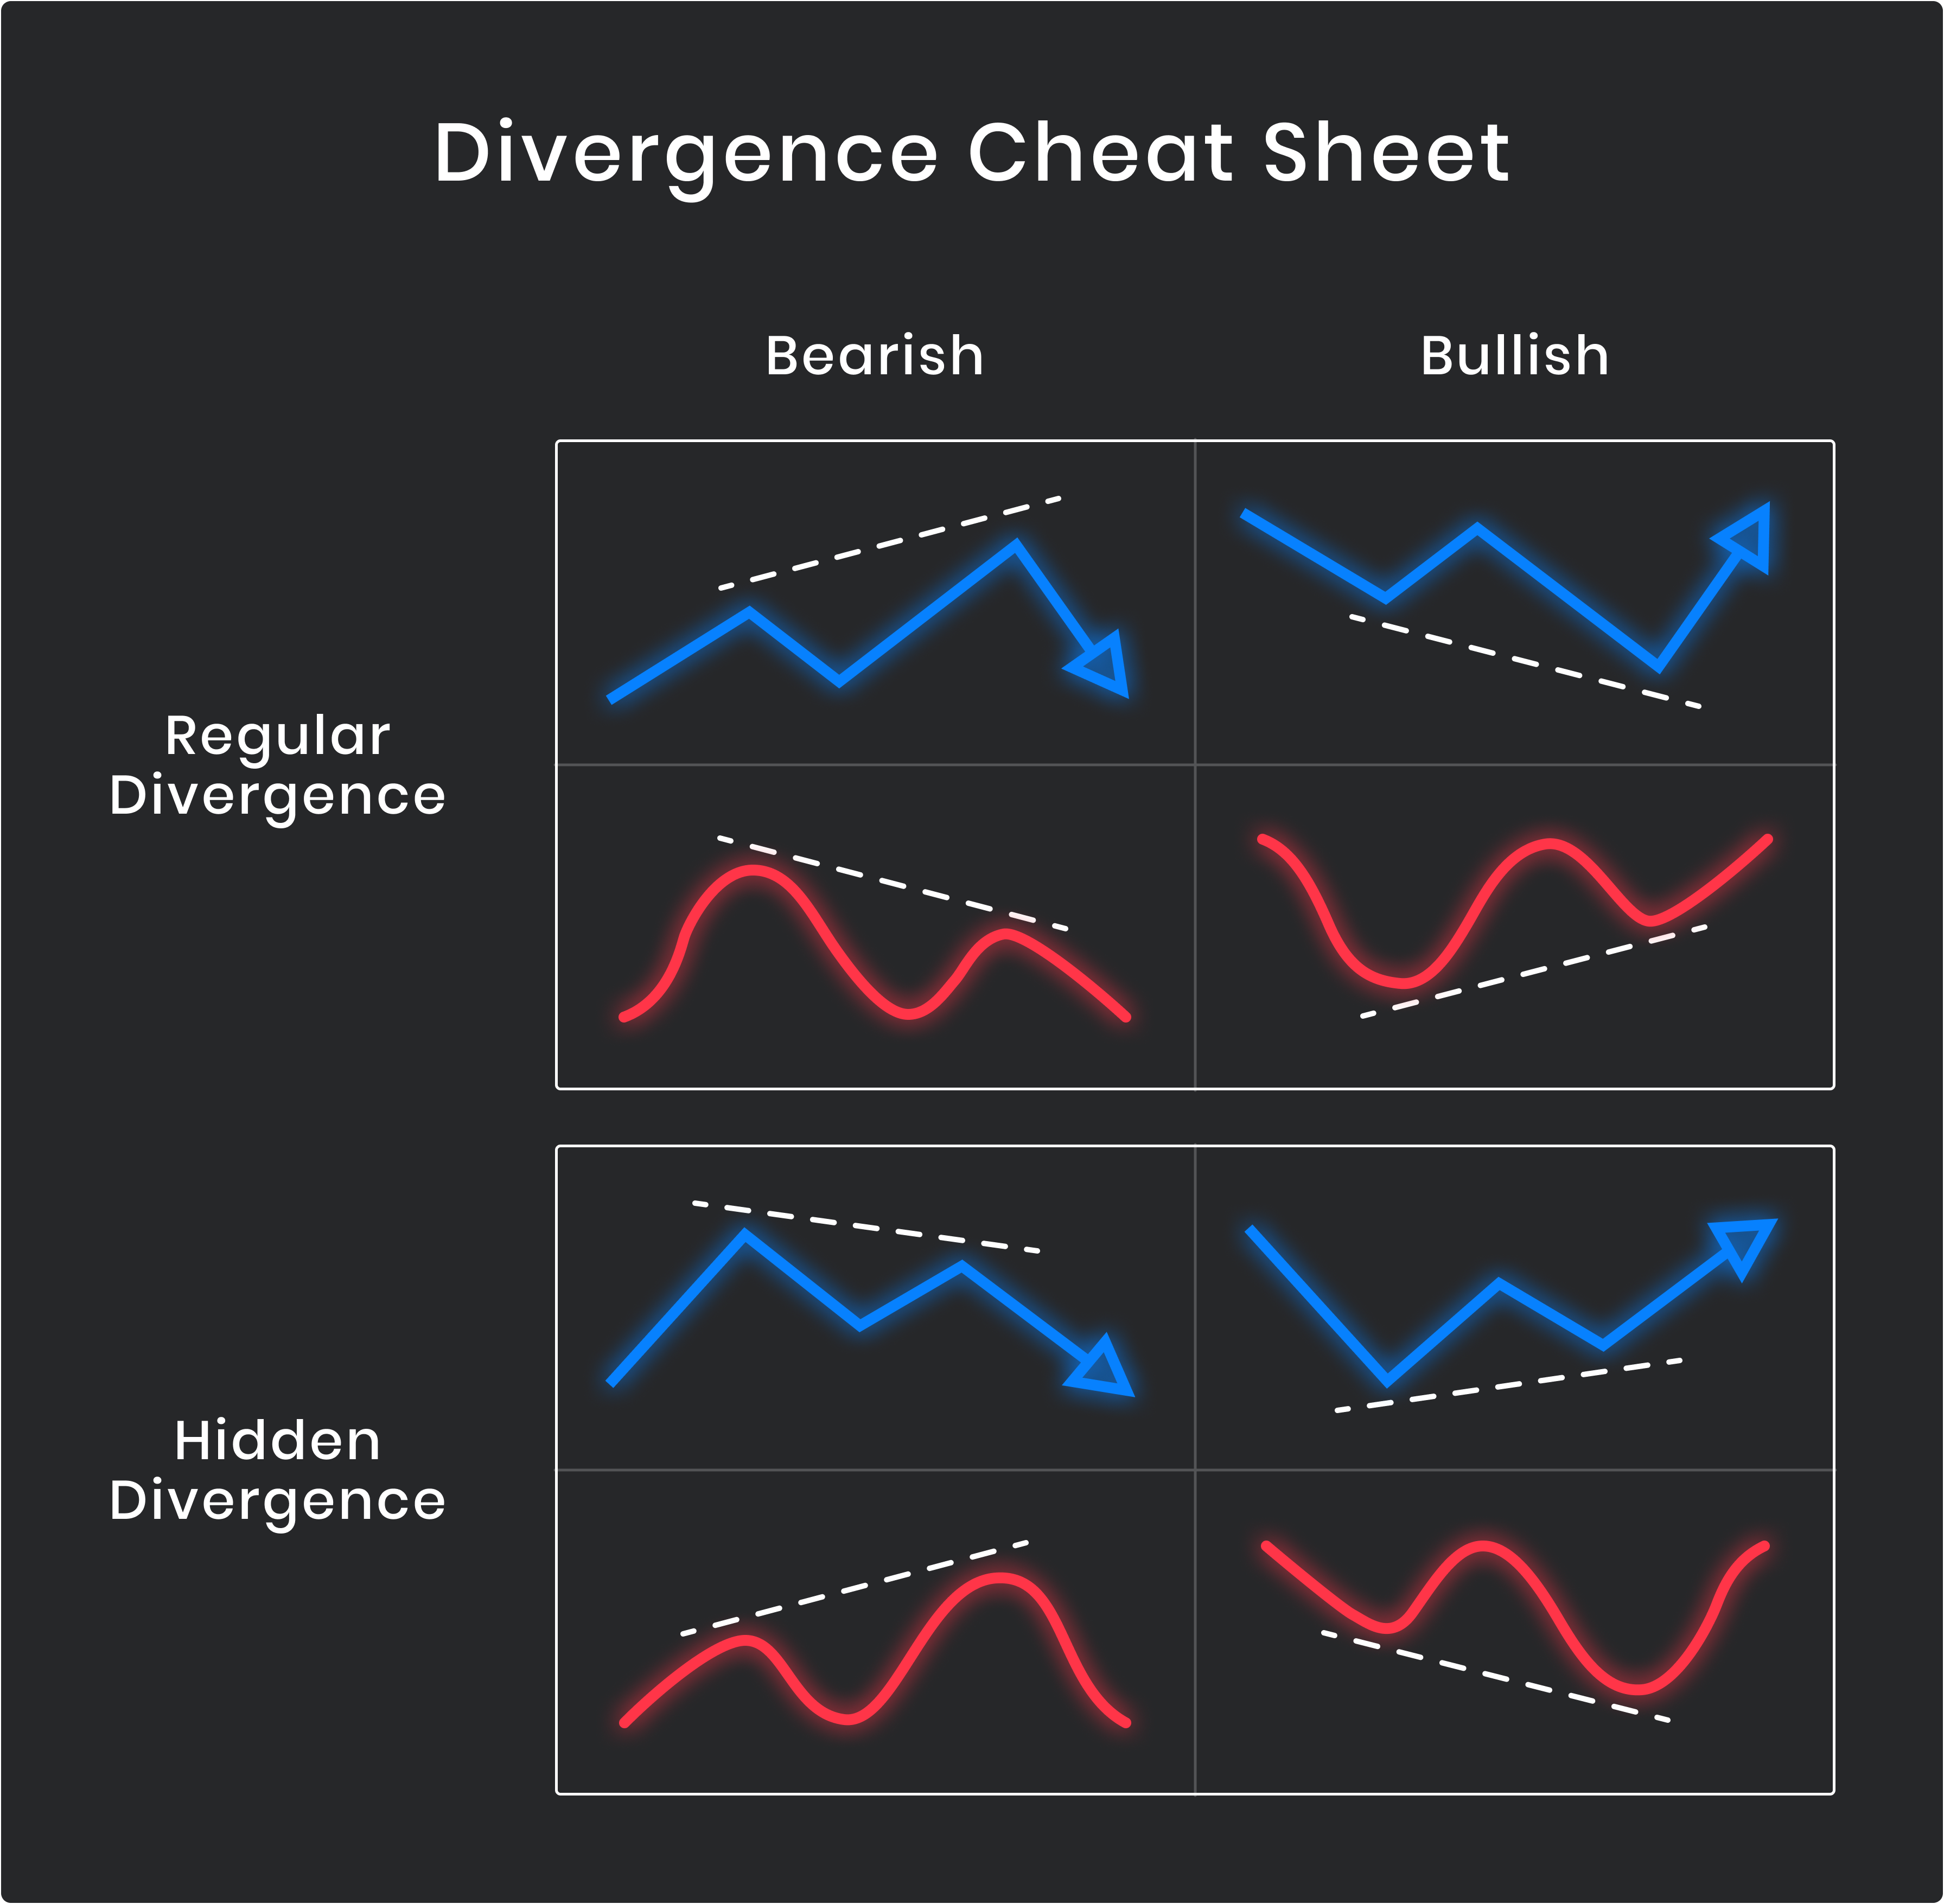
Regular divergences are useful for trend reversals, and hidden divergences can signal trend continuation. It is always well advised to use other trading confluence tools rather than just trading these divergences blindly. We can use anything from indicators or price action.
