Economic Calendar
This lesson will introduce you to the Economic calendar, also known as a macro calendar.
Economic calendar
It’s a calendar covering key global macroeconomic and political upcoming events. Basically, it tells us when key economic events like GDP, inflation, and central bank meetings occur. Macroeconomic news announcements are very often connected with higher volatility in the market. Thus, the macroeconomic calendar gives us a hint of potentional turbulence on the market. Therefore, it should be checked by the trader each day before trading. The economic calendar teaches traders to plan.
For example, if we are waiting for the trend to be changed or technical formation to be broken or finished, it can be just important news which moves the markets in a new direction. For example, according to FSSI, the central bank meeting was the news with the highest average impact of 150 pips on the FX market in 2020. Higher volatility after a news release usually lasts from 30 minutes to 2 hours. The higher volatility related to a news release may look attractive and sometimes creates an illusion of a big potential profit. However, the news release can be connected with big jumps in price, and higher spreads, which could unexpectedly hit stop loss or cause price slippage. Therefore, watching the economic calendar and awareness of key economic events should be part of each money management.
Let’s have a look at how the economic calendar works.

There are a lot of economic calendars available on many websites. It’s up to us which one we prefer to use. Mostly it’s a force of habit for each trader. In this lesson, we will look at the macroeconomic calendar available at forexfactory.com. In the upper left corner, we can see the ordinary workday calendar. At this place, we can select the day or a week of our interest. In the first column, titled date, there is the date when the news is released (in other words, by clicking on the day, we can see which news is released that day and what we can expect).
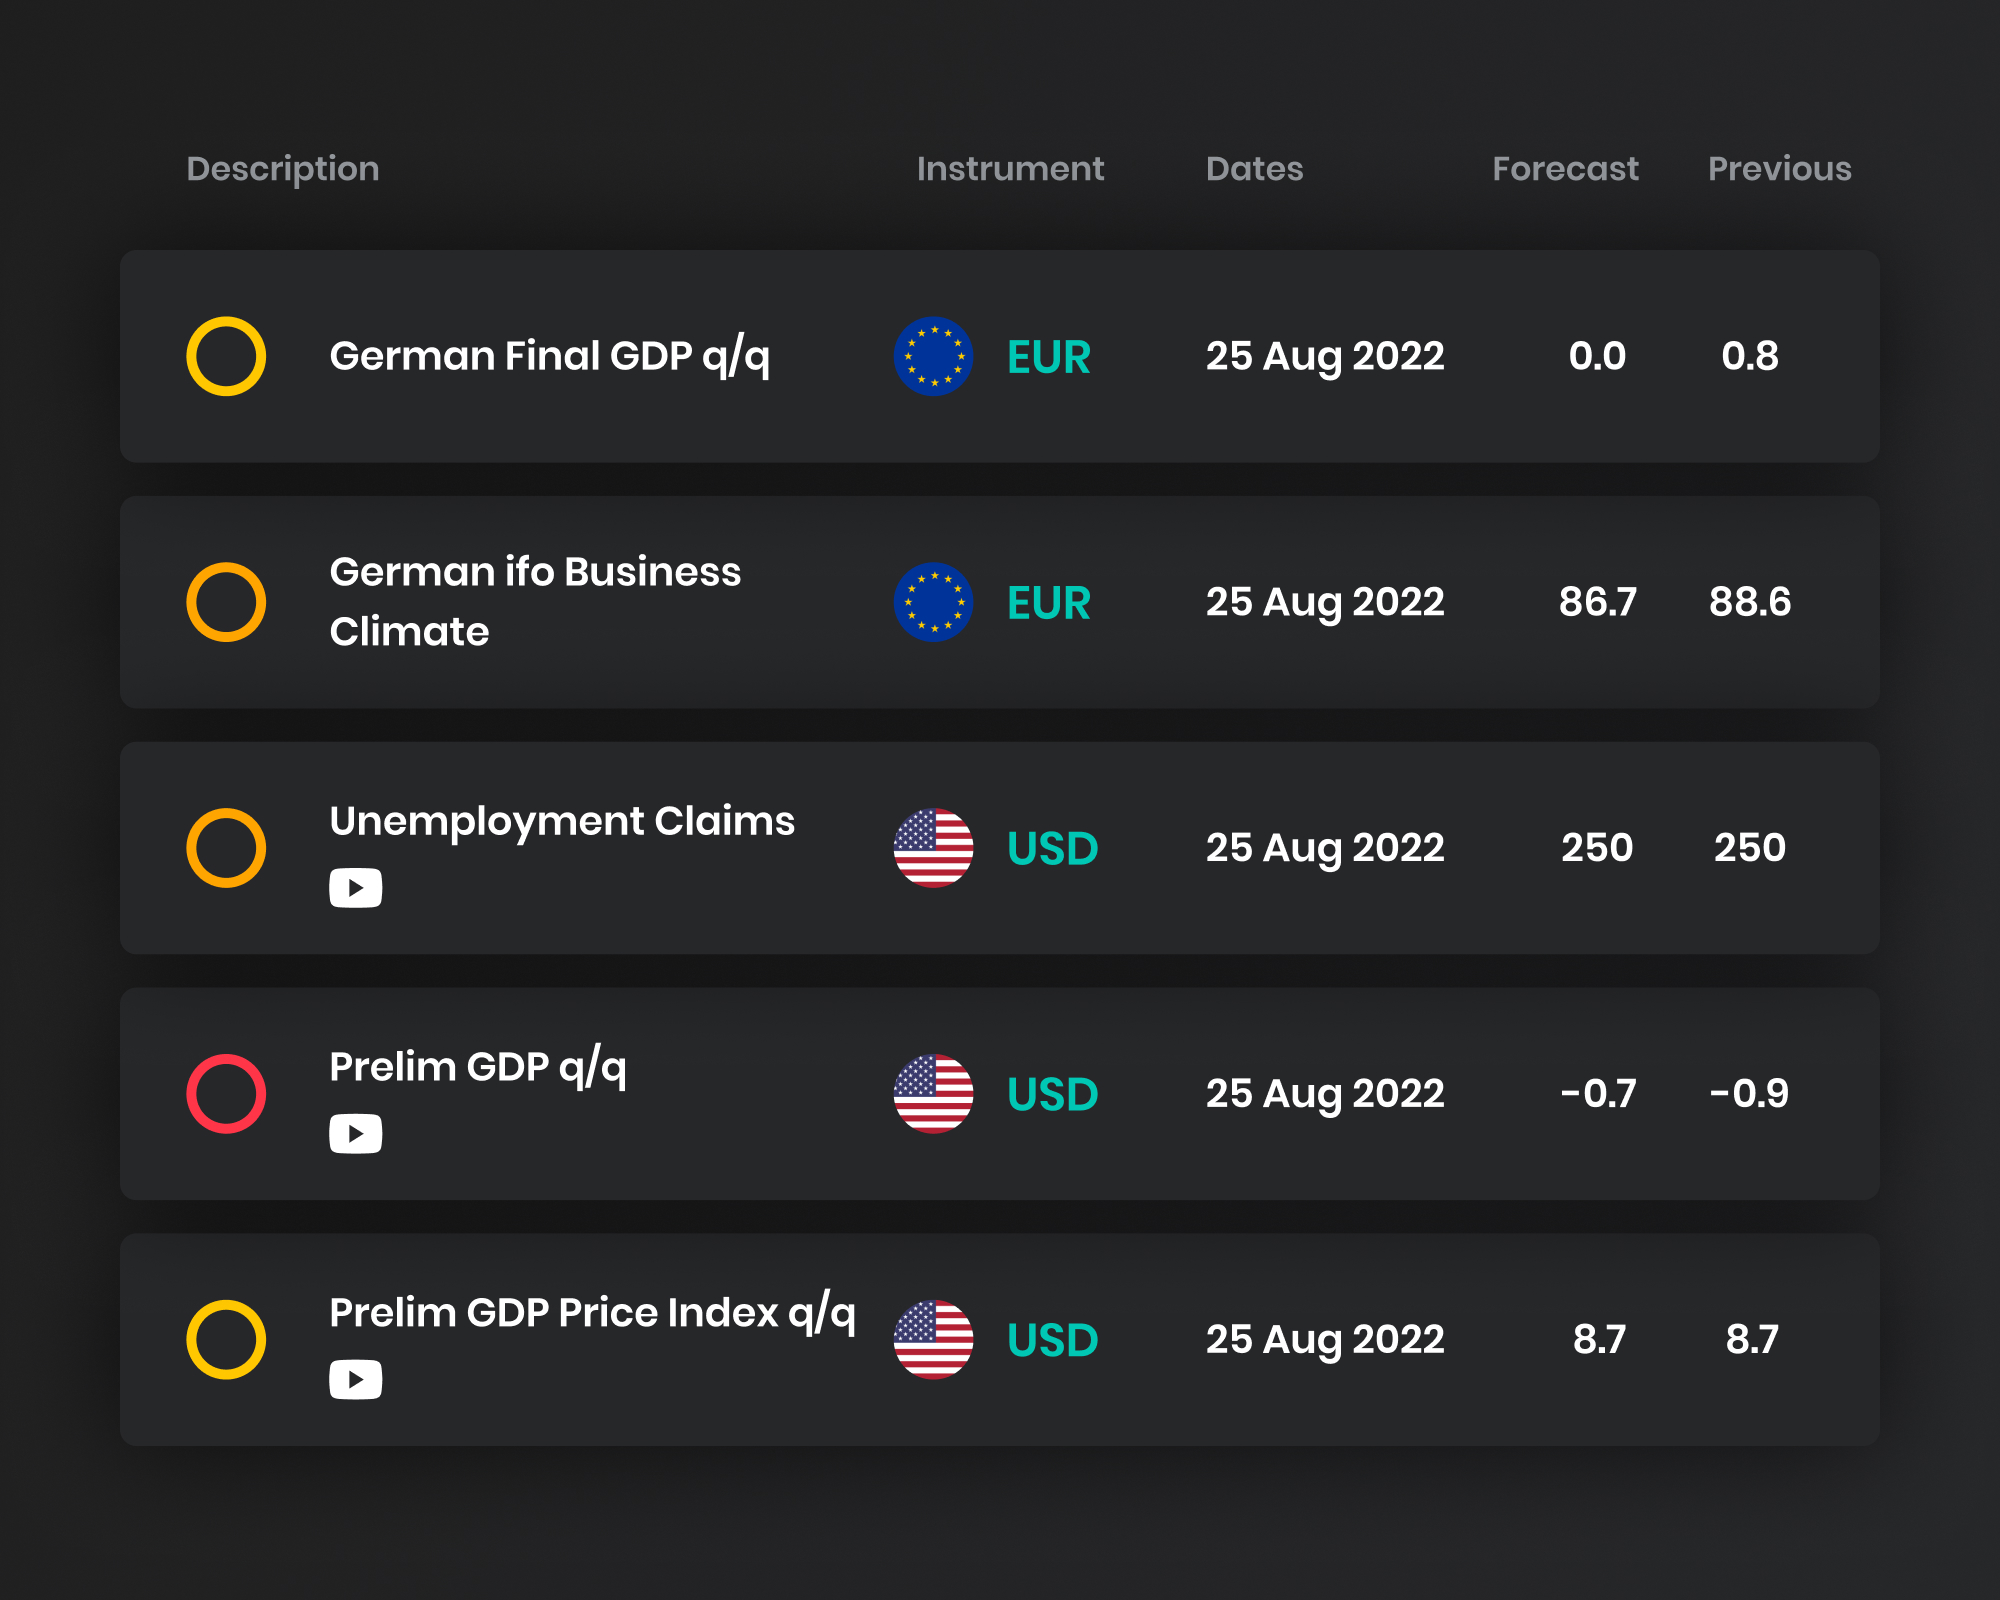
In the second corner, there is the time of the news release. Clicking on it, we can select our time zone and time format and turn on or turn off daylight saving time. The next column shows the currency impacted by the event. Generally, if the news is related to the eurozone economy, it influences the euro. If its news says something about the U.S. economy, it impacts the USD and so on. The column titled impact is a significant one. It shows the expected impact of the news on the currency. The more important the news, the bigger impact in terms of volatility is expected. Colours distinguish the strength of the expected impact. The news marked by the red factory are those with the highest expected impact on the currency, that is, with the highest volatility. The news marked with the orange factory is expected to have a medium impact on the currency, and the yellow one usually has the lowest impact. Bank holidays are marked white.
The next column tells the name of the news, which is released.
The sixth column, titled detail, offers a detailed description of the news. By clicking on it, we can read more about the news, for example, the source of the data, the frequency of publishing this news, a detailed description of this news explaining its link to the economy and, most importantly, the effect of the news on the currency. Specifically, it says that if the indicator’s released value is higher than the expected value, whether it is positive or negative for the currency.
Finally, the column titled actual provides us with the economic indicator’s latest released value. This value is compared with the forecasted value. The difference between the forecasted value (in the next column) and the actual value is the information markets are interested in, which is the source of volatility. The penultimate column, titled previous, shows the previous value of the indicator. Clicking on the last column, graph, the chart with historical values pops up. We can select a date range in the upper right corner of the chart.
Another useful tool is the filter in the upper right corner. We can customize the calendar and select the news we are interested in; for example, we want to see only the most important news (marked red) or the news coming only from the selected country (let’s say the USA). If we are more metals or energy traders, we should switch the calendar in the navigation panel.
FTMO also offers an economic calendar on its website. It takes data from the Forex factory and is very useful for FTMO clients because it marks restricted events. Also, you can watch our YouTube videos explaining the most important economic events and their impact on the market.

Naturally, reading the economic calendar may look difficult in the beginning, but it needs just a little bit of practice. Start watching the calendar every day and check the market reaction to the most important events. Most of the events are published every month. After several months of watching, everybody can master it.


