


Japanese Candlesticks
Candlestick patterns are one of the most common price action techniques. There are literally hundreds of different candlestick patterns we can find online. Do we need to know all of them? Of course not. We have picked the most common and important ones we should know. They are easily spotted on Japanese candlestick charts.
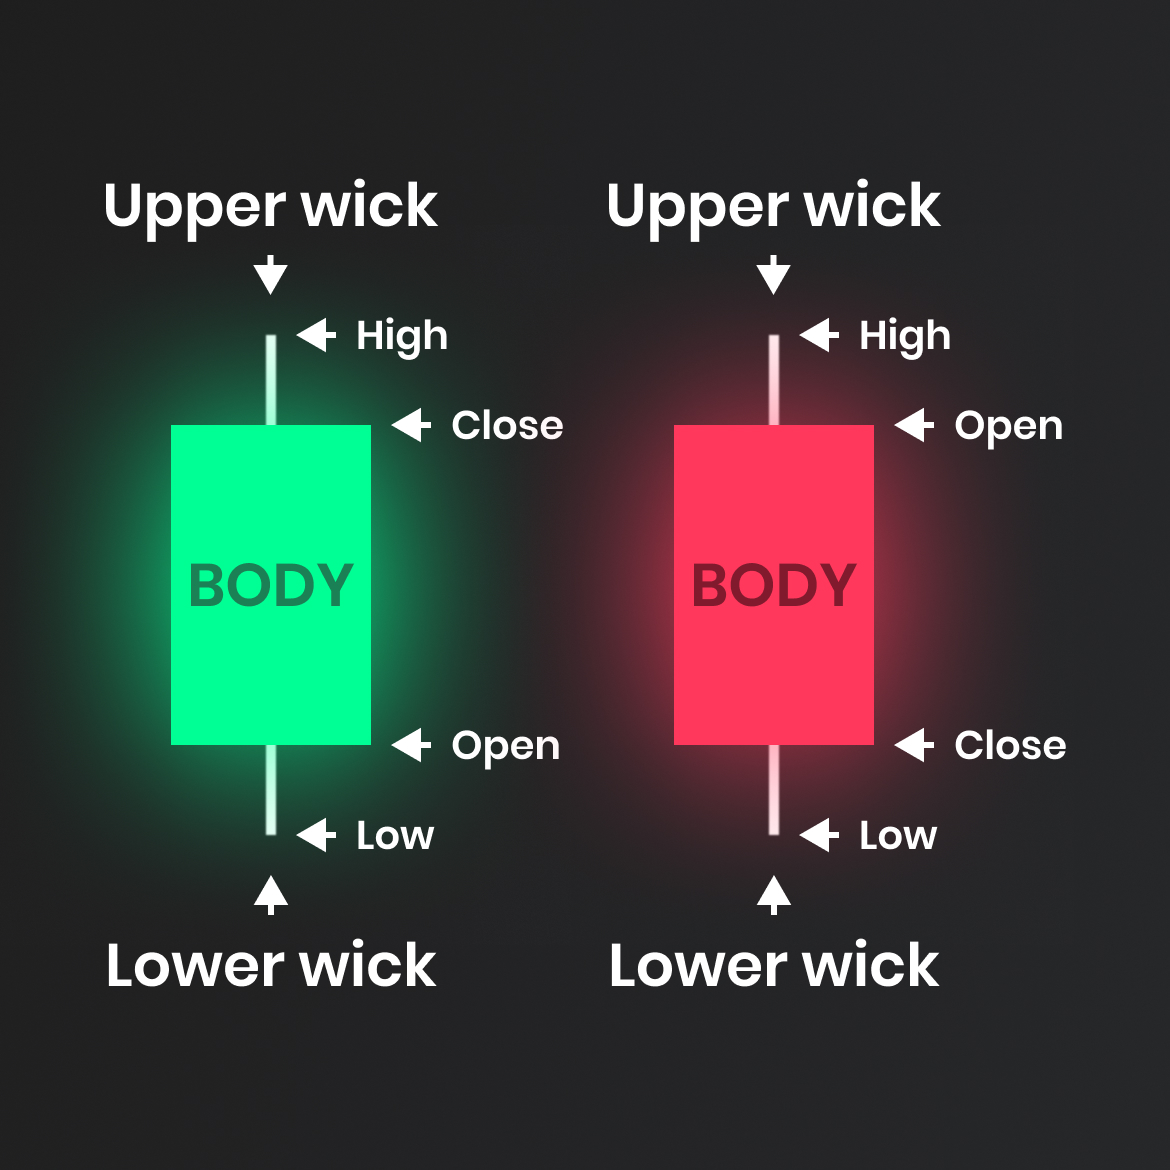
What are Japanese candlesticks?
Japanese candlesticks belong to the most popular methods of technical analysis. Searching for specific candlestick patterns was first used in the 18th century in Japan at the rice exchange. These were the very beginnings of technical trading.
The benefits of using candlestick patterns while trading price action
Among the greatest advantages of candlestick patterns are their simplicity and informational value. After a brief familiarization, the trader can quickly analyze market developments and determine what is happening in the market. Are buyers stronger than sellers, or vice versa? Can we expect the trend to cease, or on the contrary, could it gain in strength again? In fact, candlestick patterns can reveal the psychology of traders. Various candlestick shapes can suggest whether buyers or sellers are stronger. A typical example can be seen in the graph below.
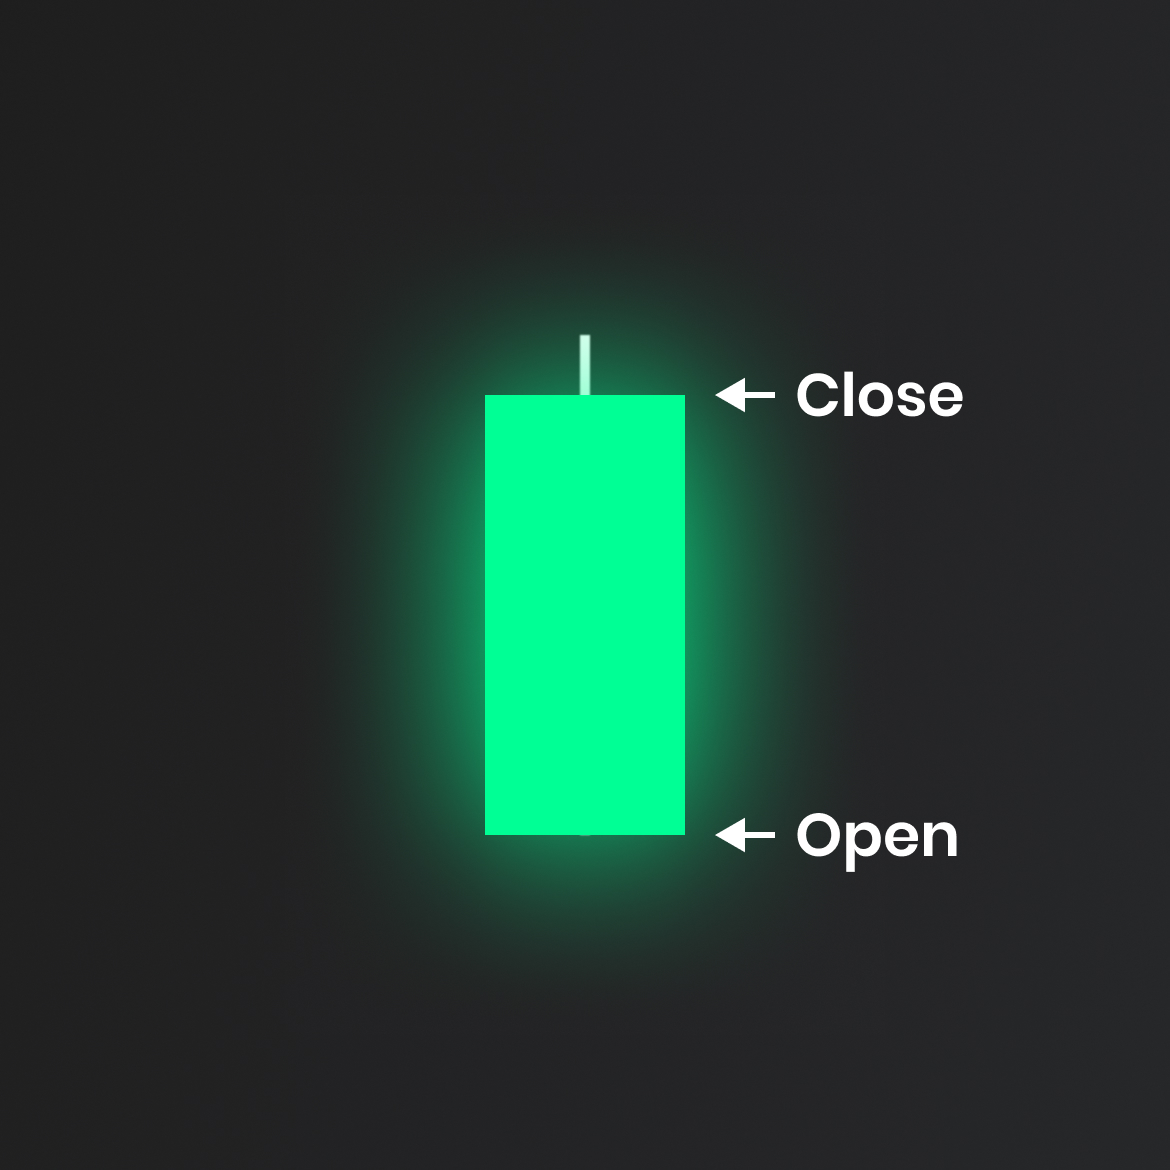
Long day bullish
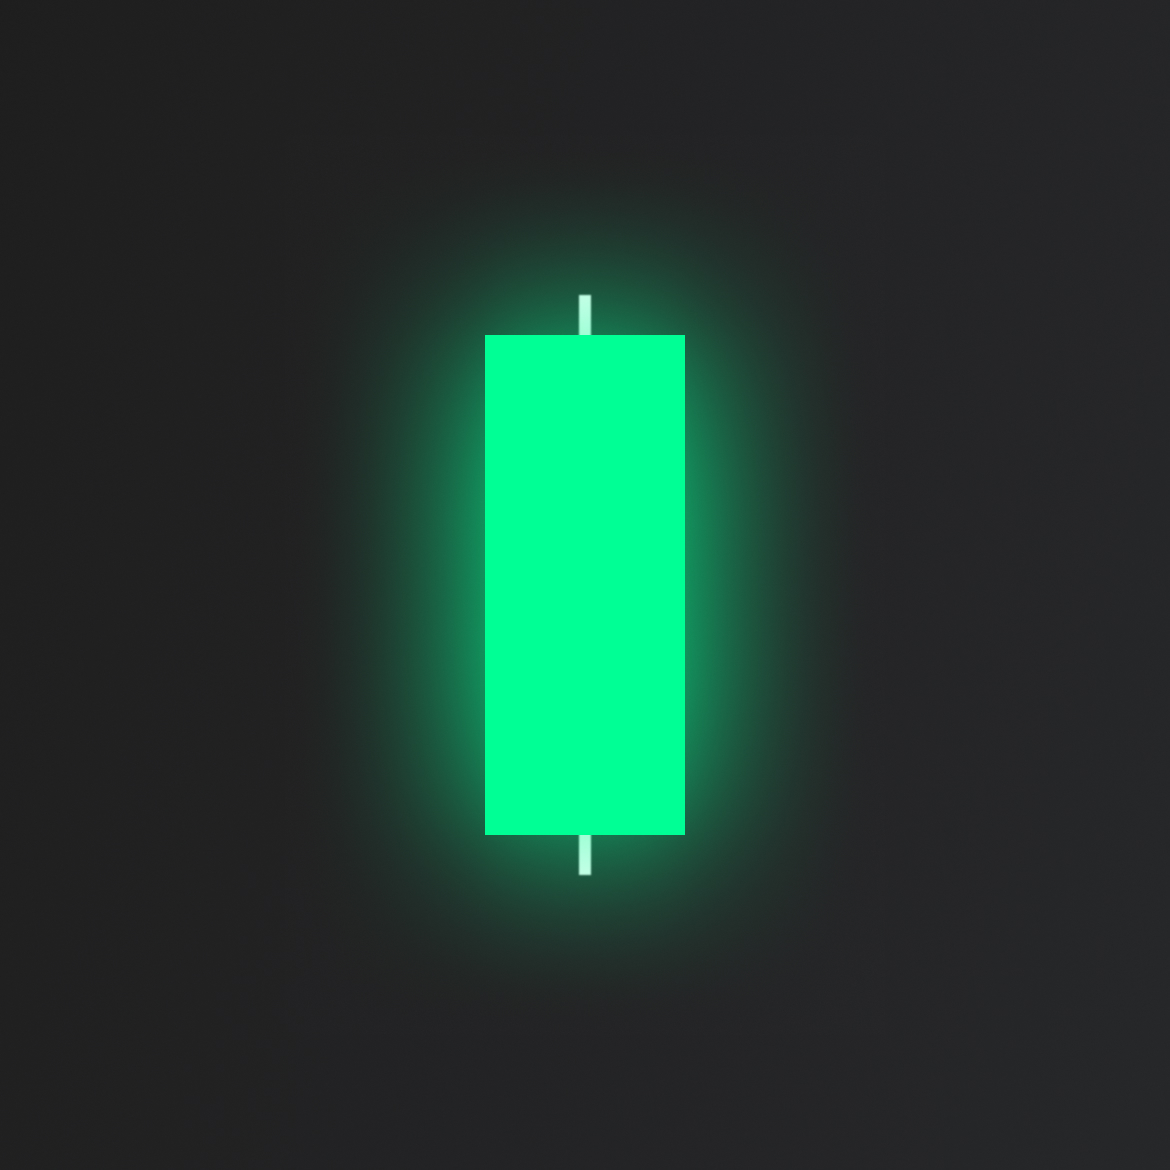
Starting with the easiest one, long day bullish candlestick. Long day bullish candlestick consists of just one candle with a long body and short wicks. This candlestick usually shows strength and it can be used as a “breakout” candle at the beginning of a trend. Traders don’t use long day bullish candlestick as entry or exit signals but more as a confluence with their ideas.
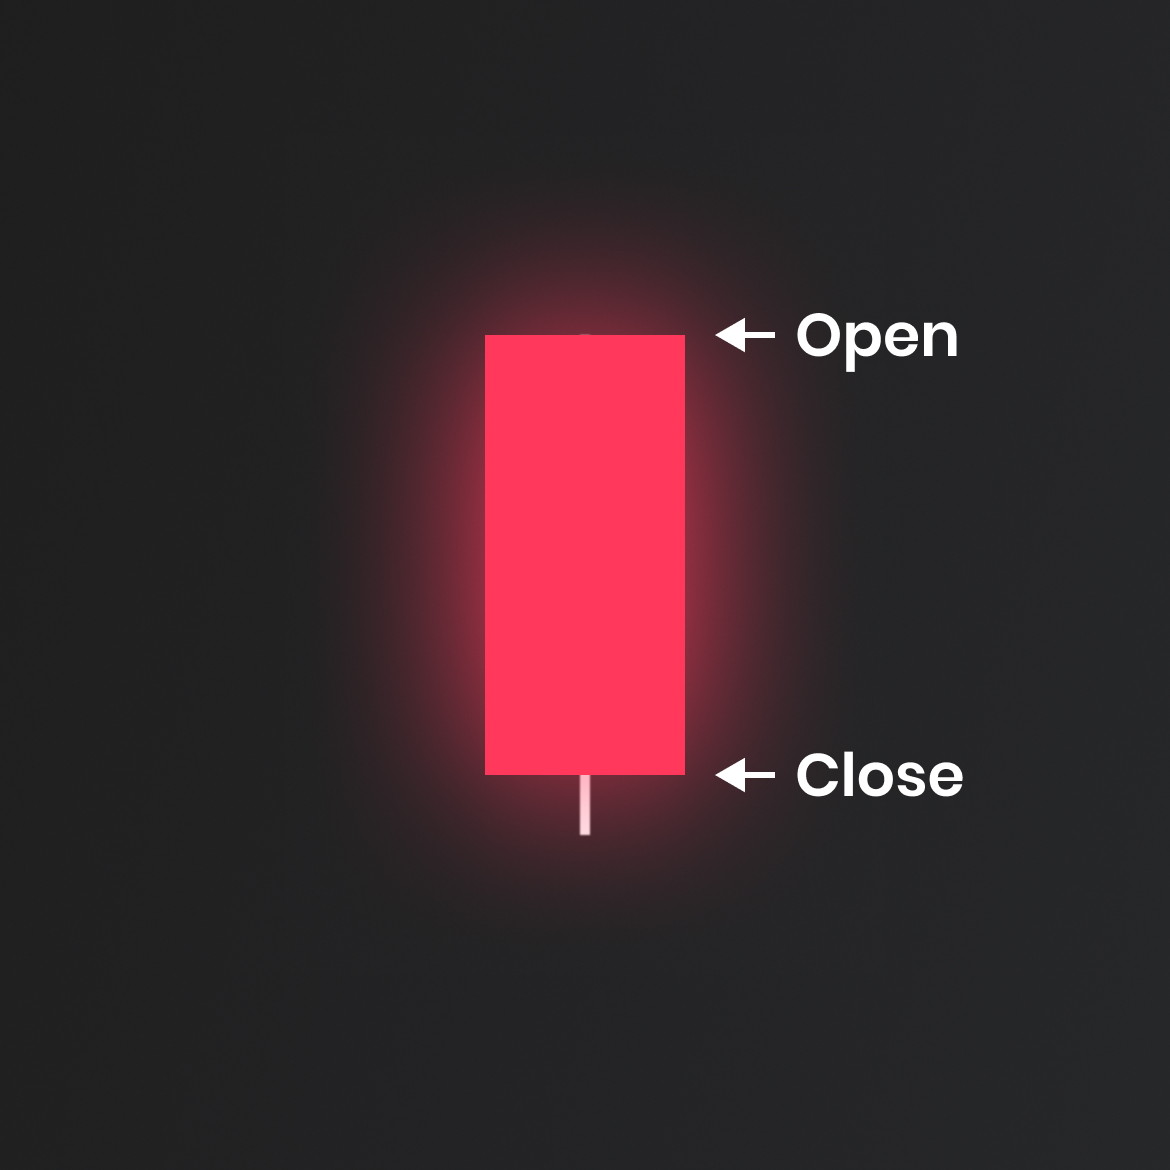
Long day bearish
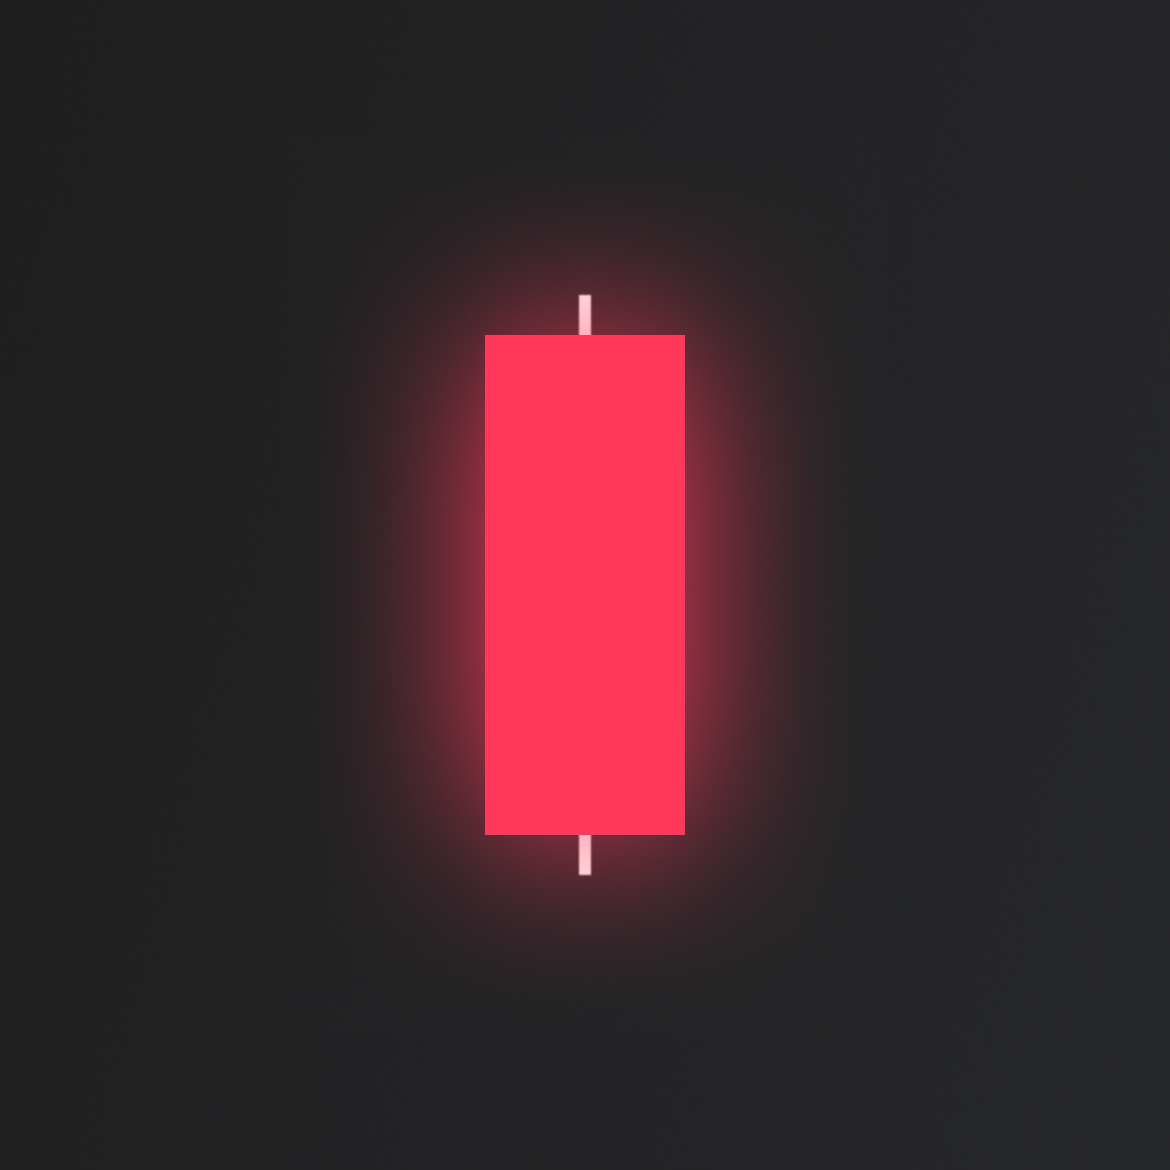
Long day bearish candlestick is represented by a big sell candle body and small wicks. It signals a weakness in the market and the fact we should start looking for the possible start of a downtrend. Long day candlesticks are simple. They can give us clues about what might happen next, but as we mentioned before, they should not be used as entry and exit signals alone.
Short day bullish
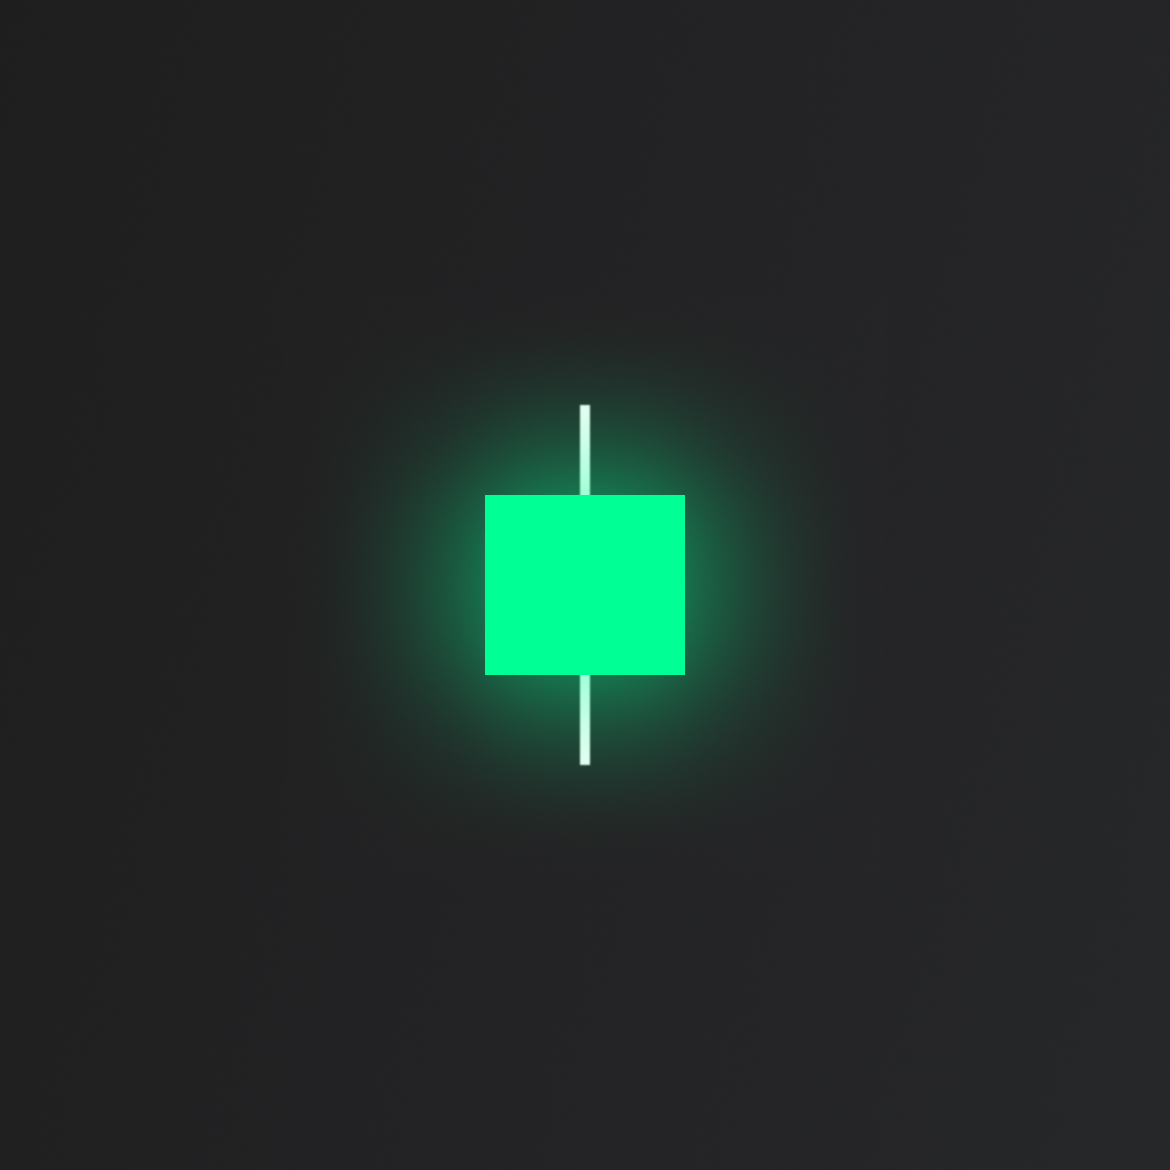
The short bullish day candlestick is an easy to spot pattern. It consists of one candlestick. Short day candlestick is defined by its length. How short must the candle be? This is not 100% defined, so we should always use our discretion and review past trading periods to have a comparison. Short day candlestick is not used as an entry/exit signal. The short day candlestick pattern signals the fact that the price stayed in the range during a trading period and we can expect an expansion soon. They can be found in the larger patterns providing relevance.
Short day bearish
This is the opposite of a short bullish day candlestick. Same as his bullish colleague, this candle is common but not so worthy on its own. We should always wait to spot it in a larger context and think about what are buyers or sellers trying to achieve in current market conditions.
Bullish marubozu

A very simple and powerful candlestick pattern is called marubozu. Spotting marubozu candlestick is one of the easiest things we can do. It signals a real long body without an upper or lower wick. Bullish marubozu candlestick shows us one pretty obvious thing, the buyers stepping in the market.
There are two situations where we can make a trading decision with a bullish marubozu candlestick:
- If we spot bullish marubozu in an uptrend, trend continuation is likely.
- If a bullish marubozu occurs in the downtrend, a reversal is likely to happen.
Bearish marubozu
Bearish marubozu has the same two uses as bullish one, they are just reversed.
- If bearish marubozu happens in a downtrend, the trend is likely to continue.
- If bearish marubozu occurs in the uptrend, reversal is likely to happen.
The smart thing to do after we see a marubozu candle is to wait for further confirmation in term of another candlestick patterns, support and resistance or indicators.
Bullish closing marubozu
There is only one small difference from a bullish marubozu: a lower wick. This candlestick suggests that we had some sellers trying to step in after the candle opened but buyers were much stronger and closed higher. If a bullish closing marubozu appears in an uptrend, it gives us a signal of continuation. Another great location of bullish closing marubozu is at a key support area where we can expect the price to rise higher.
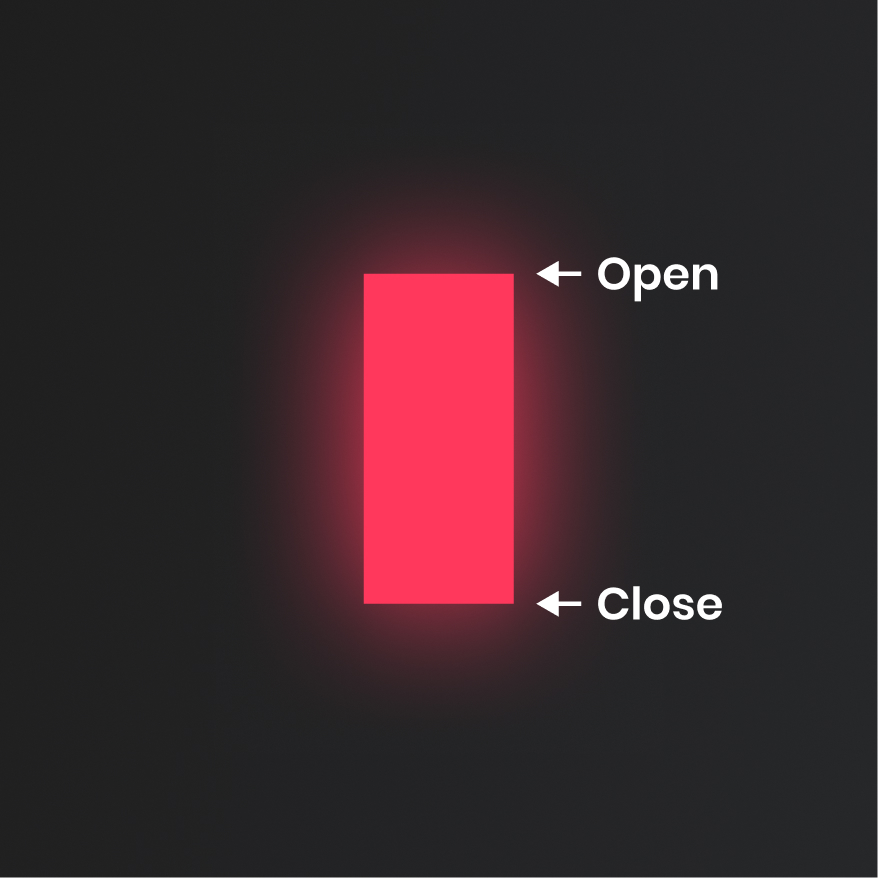
Bearish closing marubozu
Bearish closing marubozu is a bearish candlestick pattern which is signalled with a small upper wick and a big bearish body. There are 2 locations where we should be watching for bearish closing marubozu. In a downtrend, this signals that trend is likely to continue and at a key resistance level where we can expect a new move down to begin.
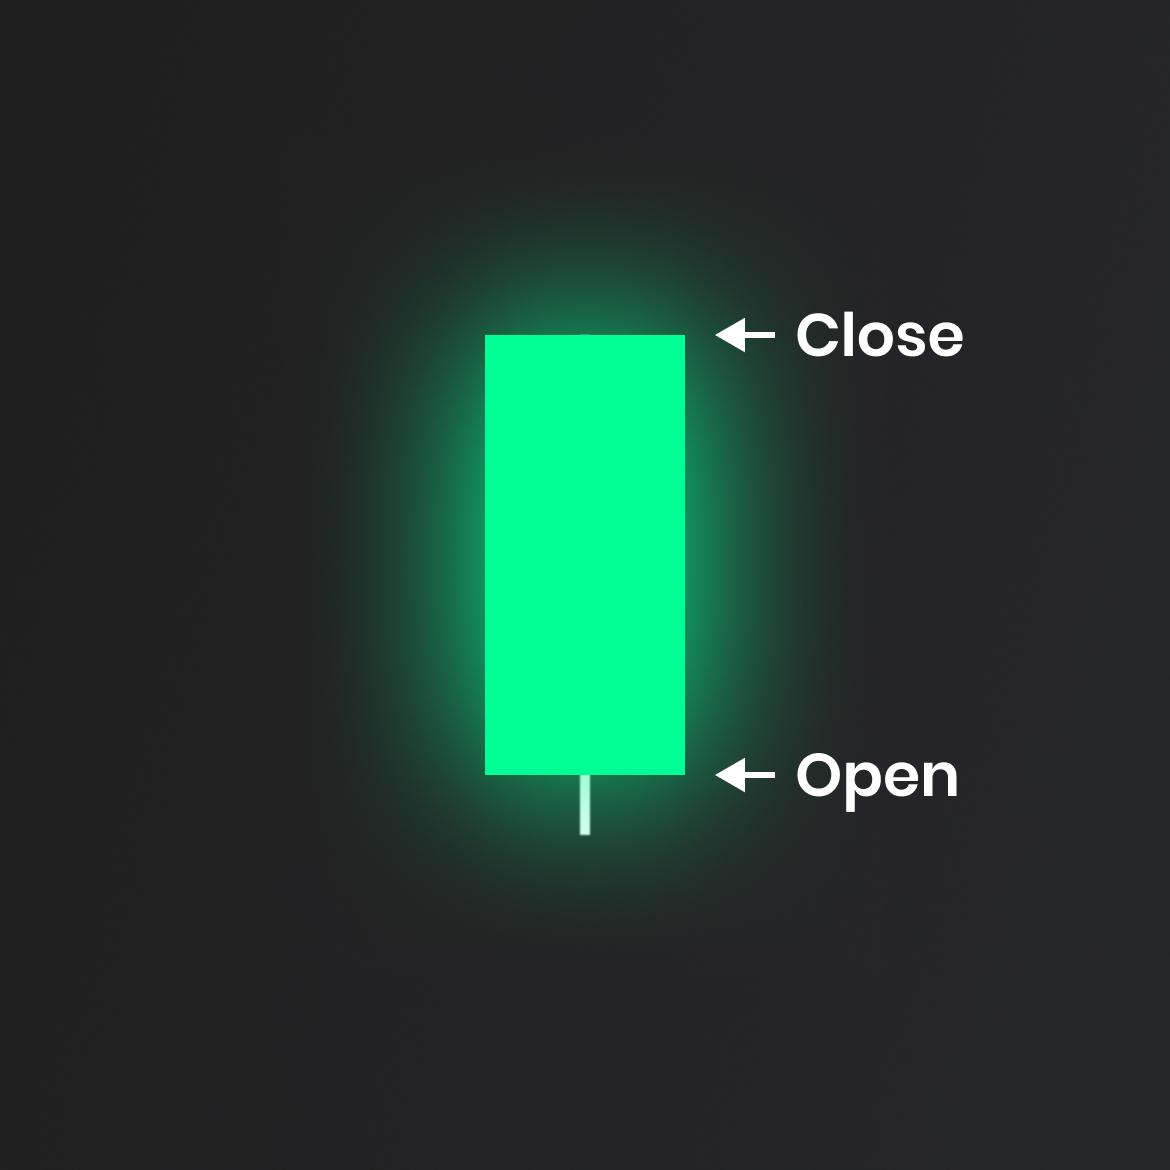
Bullish opening marubozu
Even though bullish opening marubozu has a small upside wick, it is a very bullish signal in the market. It shows the fact that buyers took control straight from the open and even though they met some sellers at the top, the bullish bias prevails.
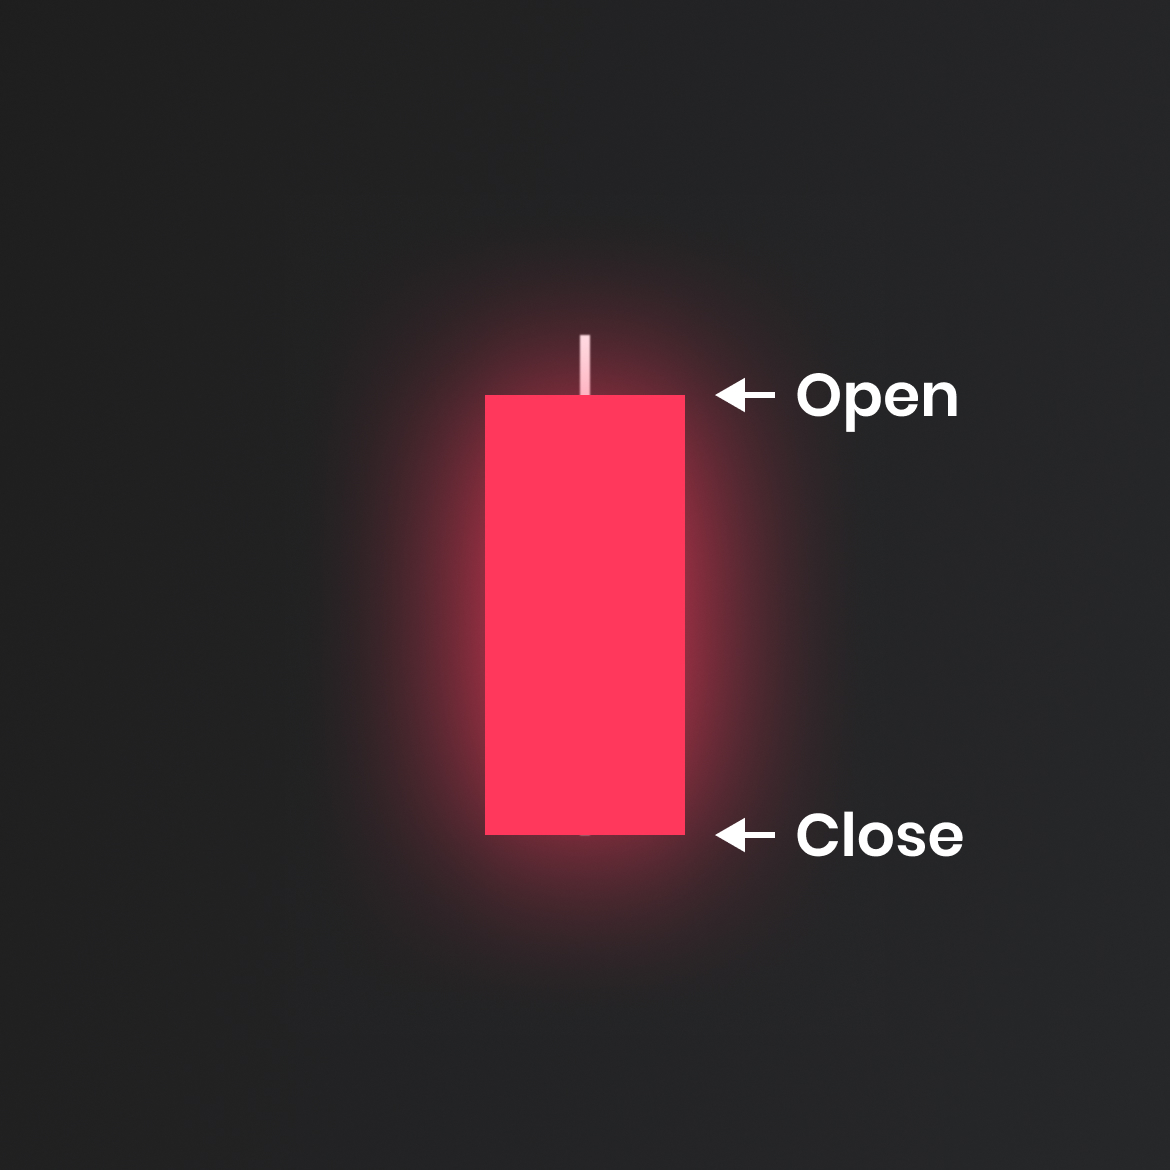
Bearish opening marubozu
Bearish opening marubozu signals strong conviction from sellers in the market. Although there is a small lower wick, we can notice a price rally right after the candle opens. Bearish opening marubozu in a downtrend signals continuation; in an uptrend, it can signal a possible trend reversal.
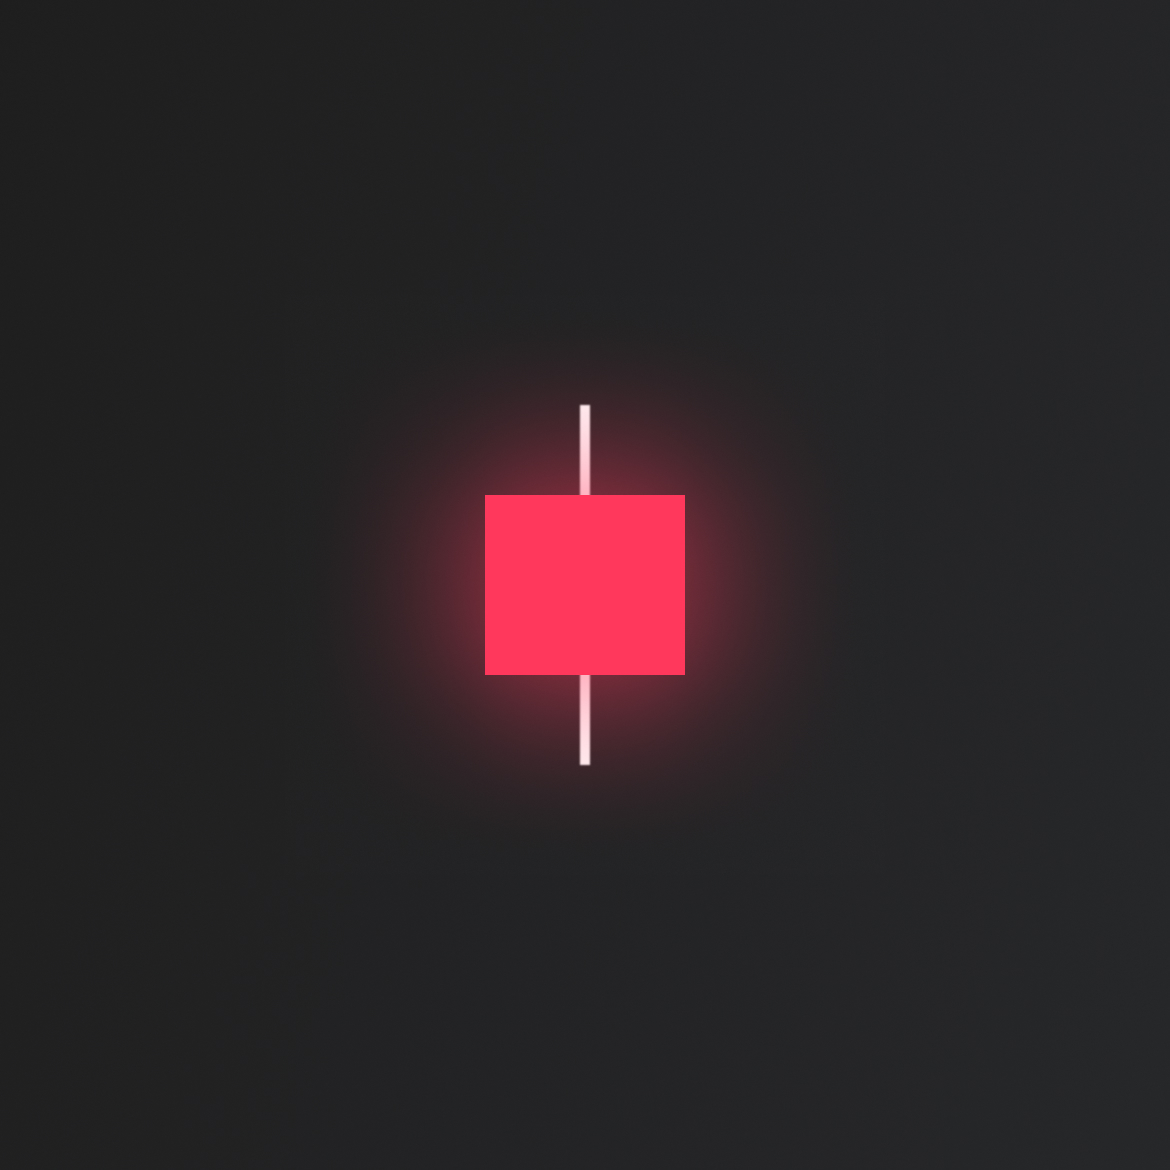
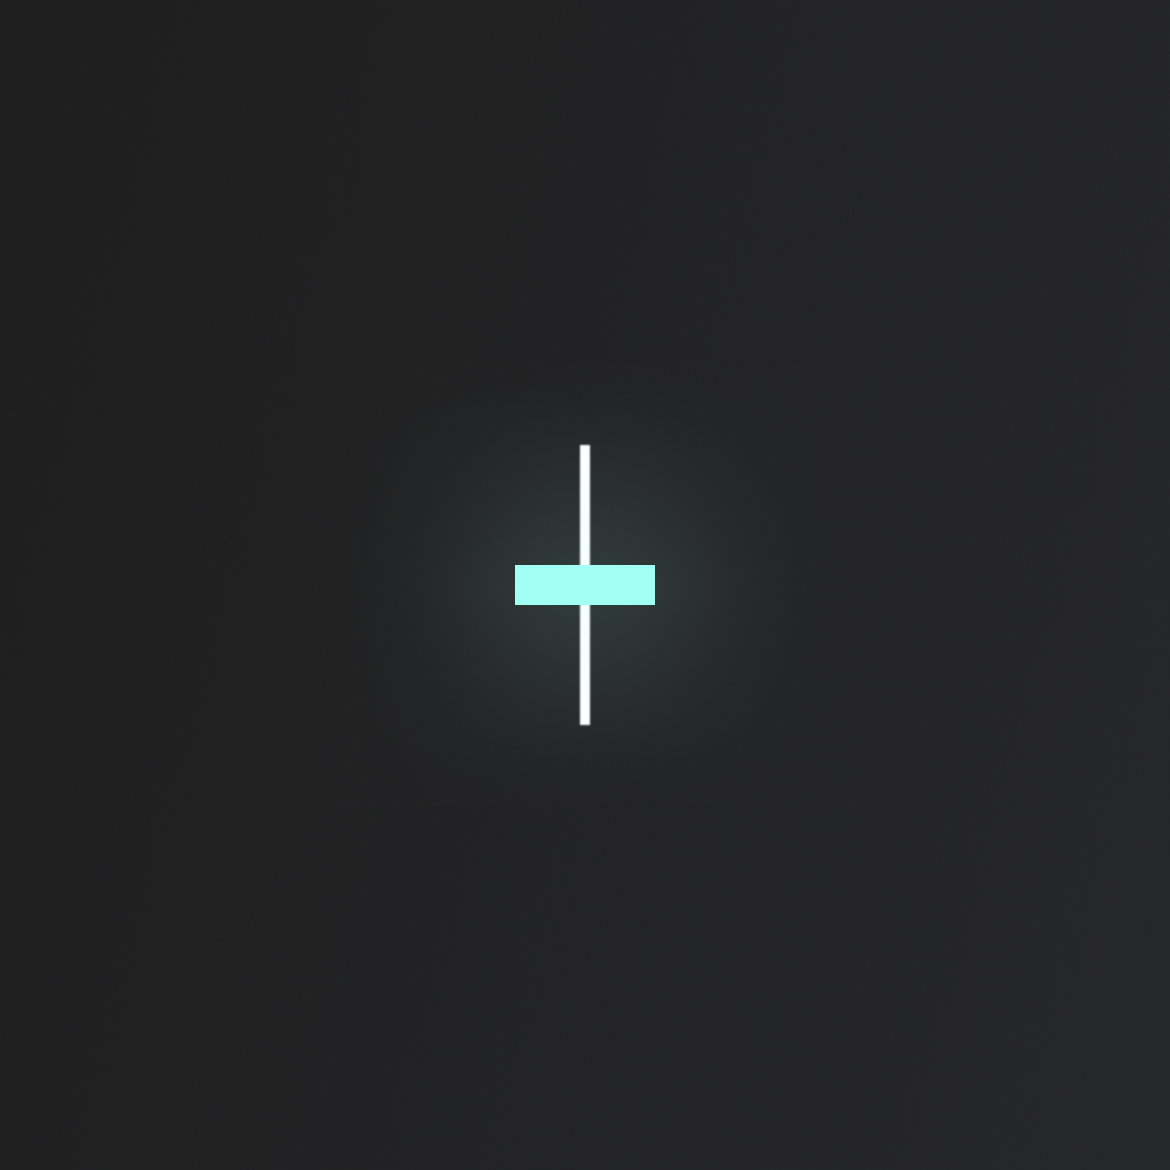
The spinning top

The spinning top candlestick pattern is a neutral candlestick. By neutral, we mean the fact that it doesn’t matter that much if the candlestick closes bullish or bearish, the important factor is the candlestick closing location. The spinning top candlestick pattern has a single candle with a small body and long wicks. It signals indecision in the market, the general rule of thumb is that if we see the spinning top candlestick at the resistance level, it’s a short reversal signal. Vice versa, spotting the spinning top candlestick at the support area signals a long reversal.
The doji candlestick pattern
Similar to the spinning top candlestick, doji is an indecision candlestick pattern. We can recognize a doji candle with a very small body with an open and close that are virtually equal. A doji is often found at the tops and bottoms of trends, so it is considered as a sign of possible reversal of the movement. That being said, more complex doji patterns can also be used in trend continuation. Although doji is an indecision candlestick pattern, there are three different variations that are going to help us make more educated trading decisions, there are long-legged doji, gravestone doji, and dragonfly doji.
Long-legged Doji

A long-legged doji is very similar to the spinning top candlestick. Compared to regular doji, it is a much more dramatic candle with long upper and lower wicks. Long-legged doji is the same as the spinning top candlestick, it signals indecision in the market and a possible reversal in play.
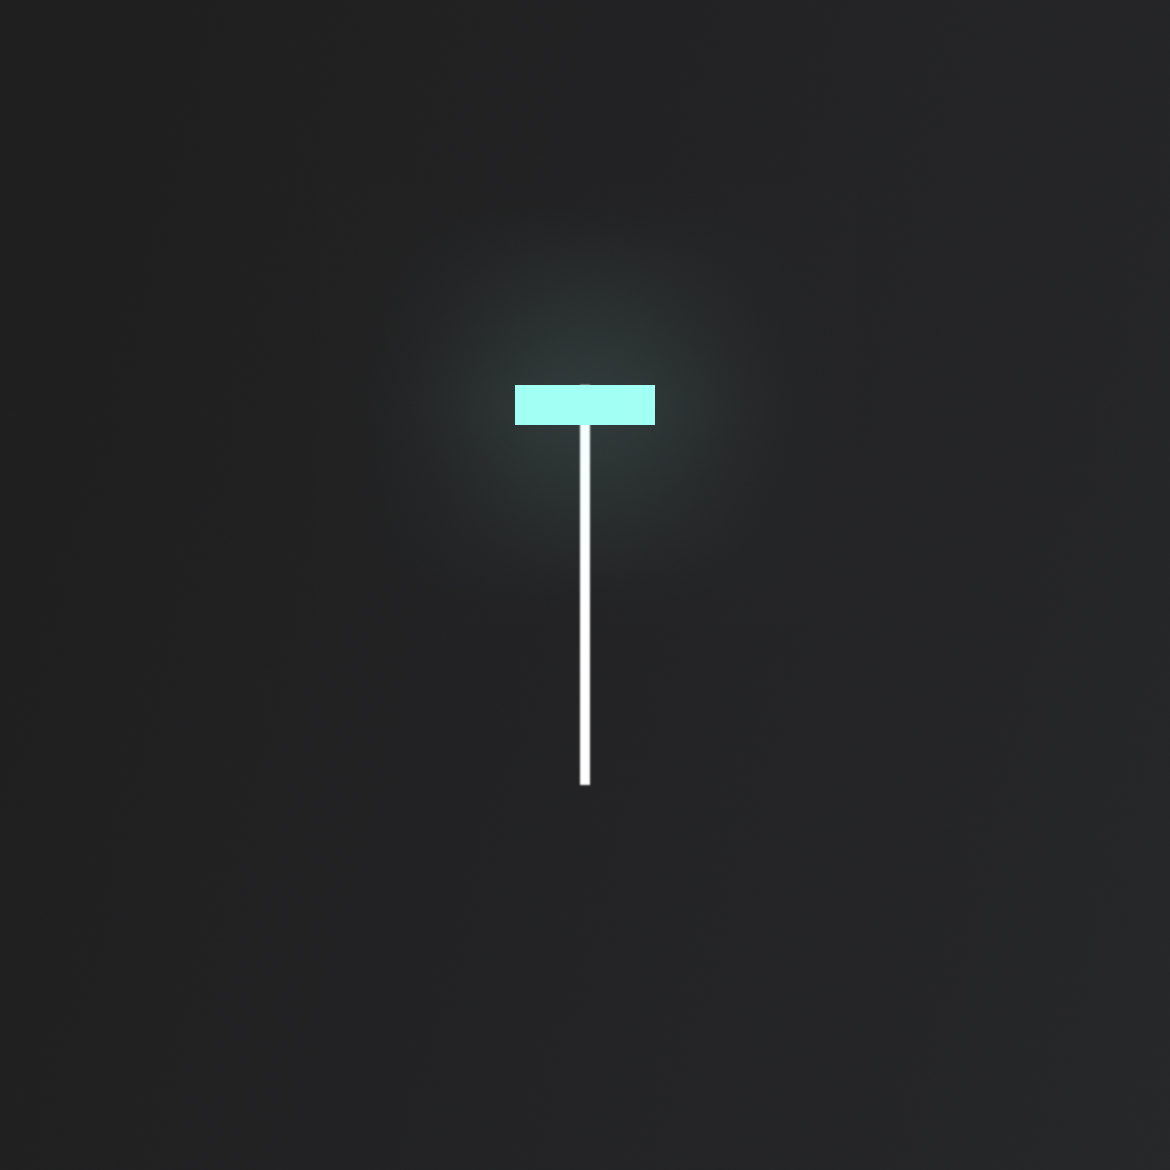
Gravestone Doji
Gravestone Doji is a bearish candlestick pattern. It shows us the fact that buyers tried to step in, but sellers strongly overcame them and pushed the price back to open. In an uptrend, gravestone doji indicates that the market is ready to turn around. In a downtrend, we can use a gravestone doji as our continuation signal.
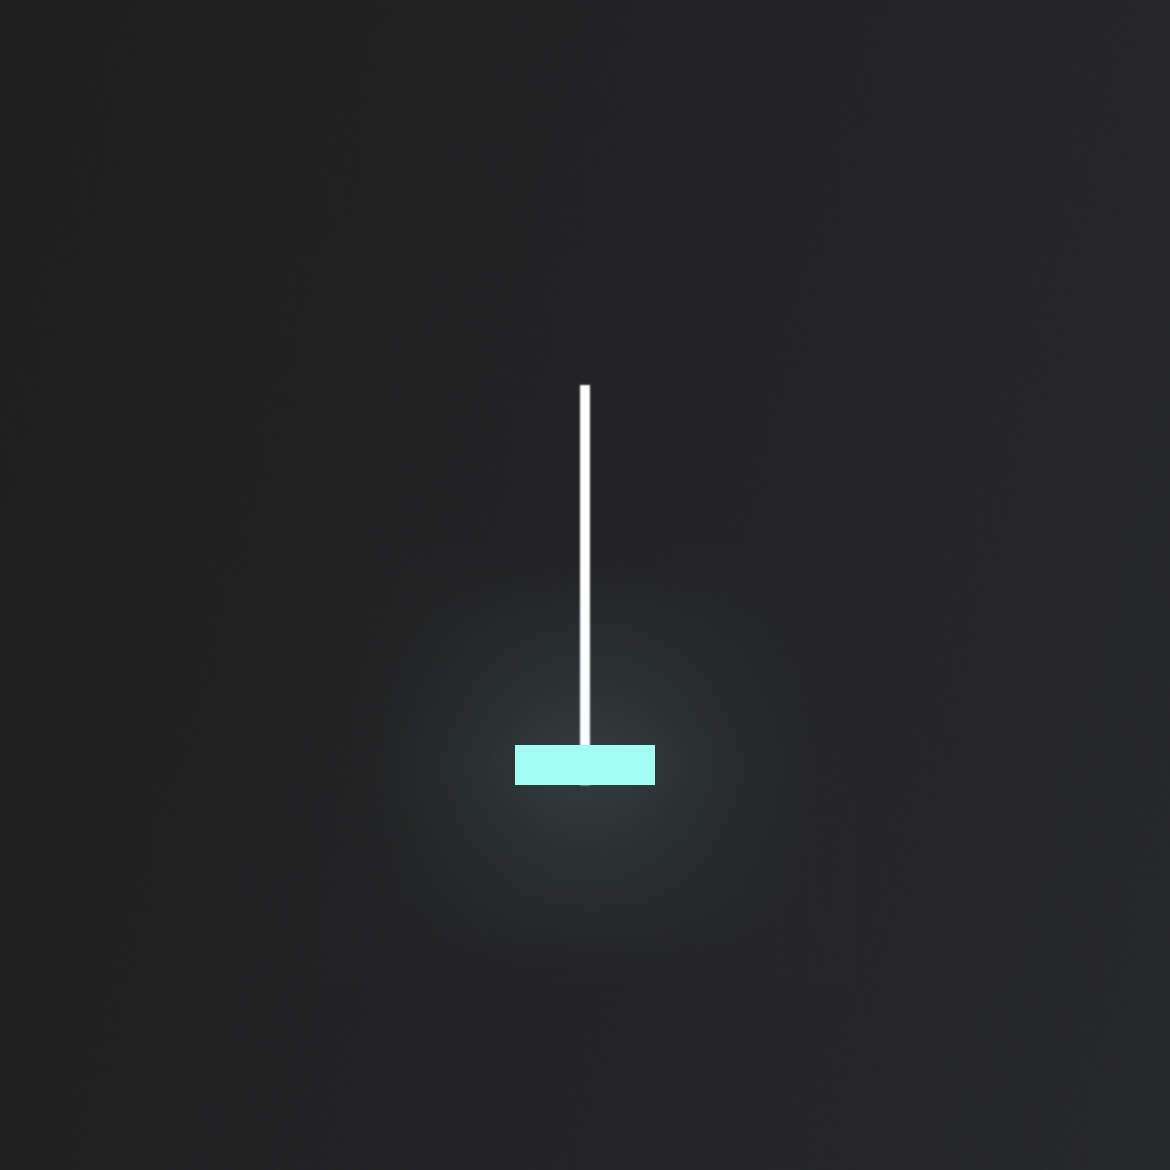
Dragonfly Doji
Dragonfly doji is a bullish candlestick pattern. It shows us the fact that sellers tried to step in, but buyers strongly overcame them and pushed the price back to open. In a downtrend, dragonfly doji indicates that the market is ready to turn around. In an uptrend, we can use dragonfly doji as our continuation signal.
Bullish engulfing
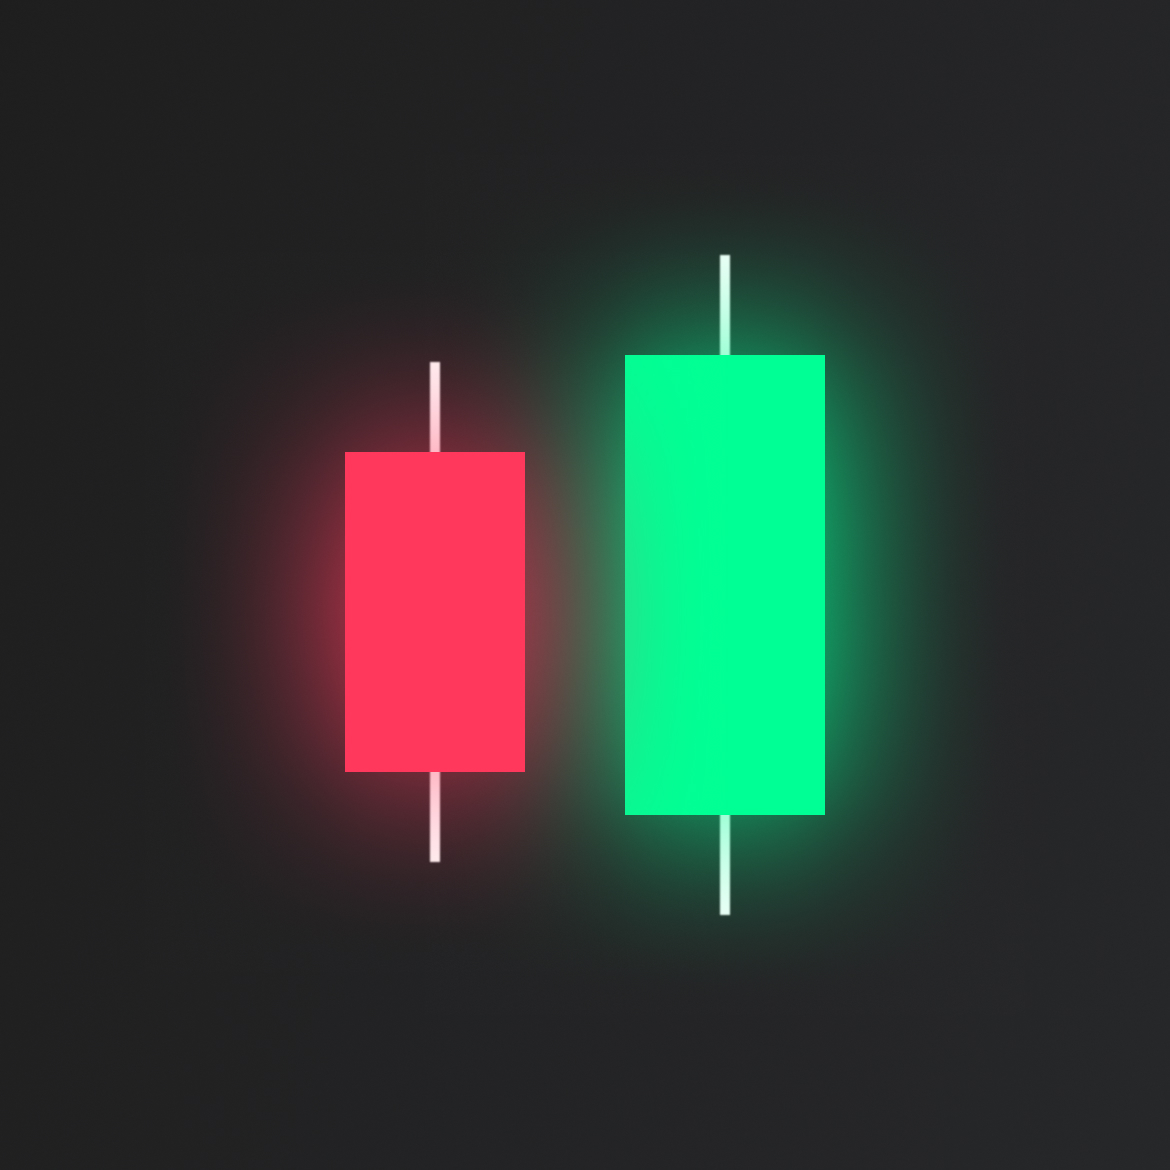
A bullish engulfing is the first 2 candlestick patterns we have. It forms with a small red candle on the left and a big green candle on the right. The big green candle on the right has to completely overlap/engulf the candle on the left.
Bearish engulfing
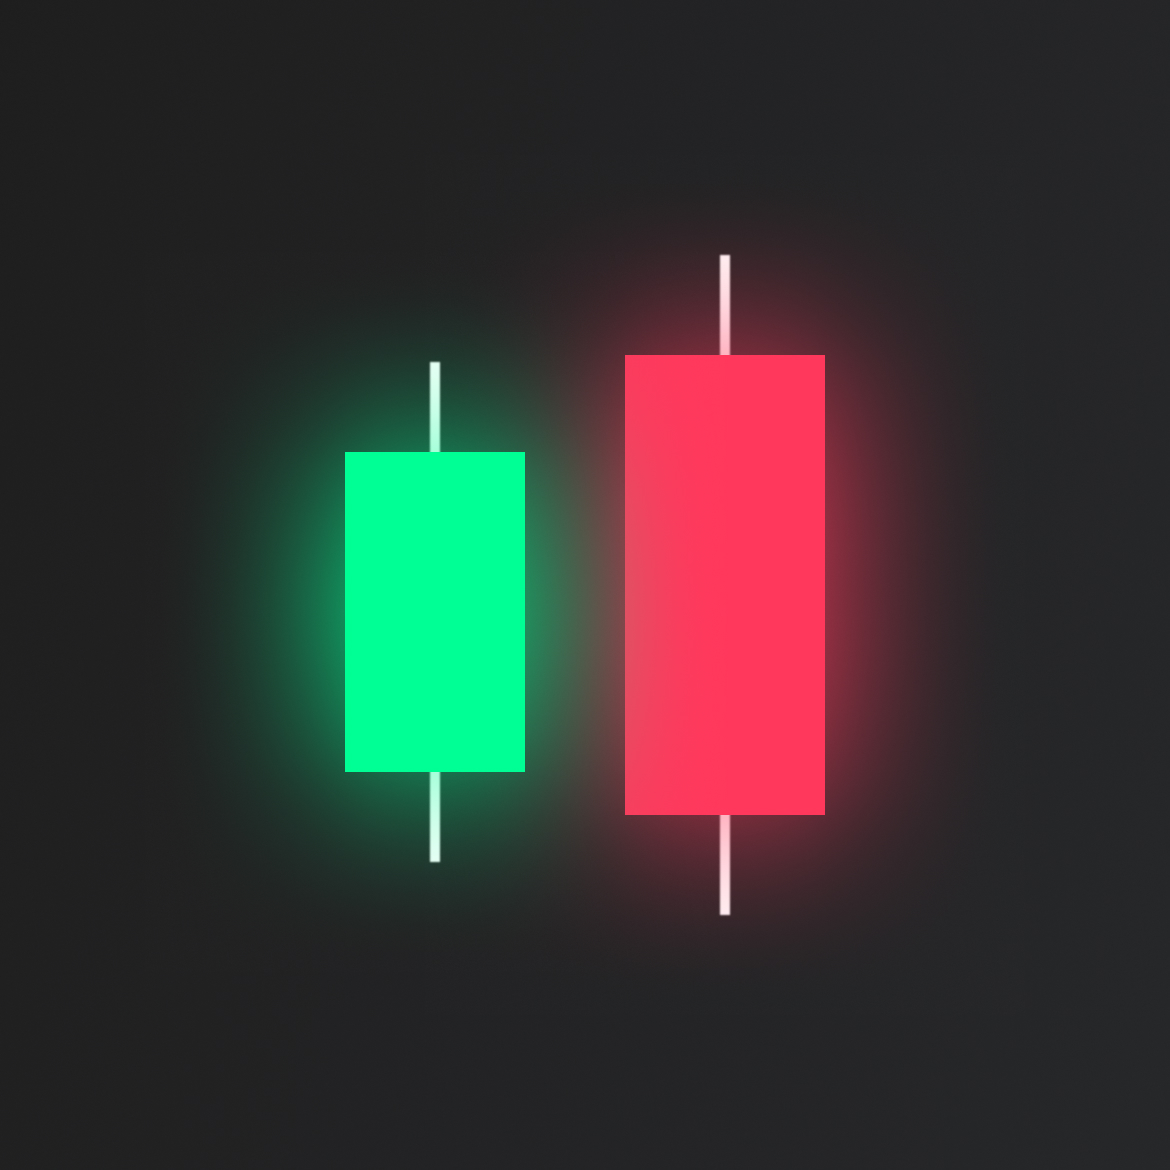
Bearish engulfing forms with a small green candle on the left and a big red candle on the right. The big red candle on the right has to completely overlap/engulf the candle on the left.
