


Market Environment – Ranges vs Trends
Hello traders, in this lesson, we will have a look at different types of trading environments.
Market environments – range vs trend
Recognizing these early on and adjusting our trading strategy to them is one of the most important things to do. Trading ranges and trends require almost diametrically different approaches. But before we go into that, let’s cover some basics and demonstrate how they look.
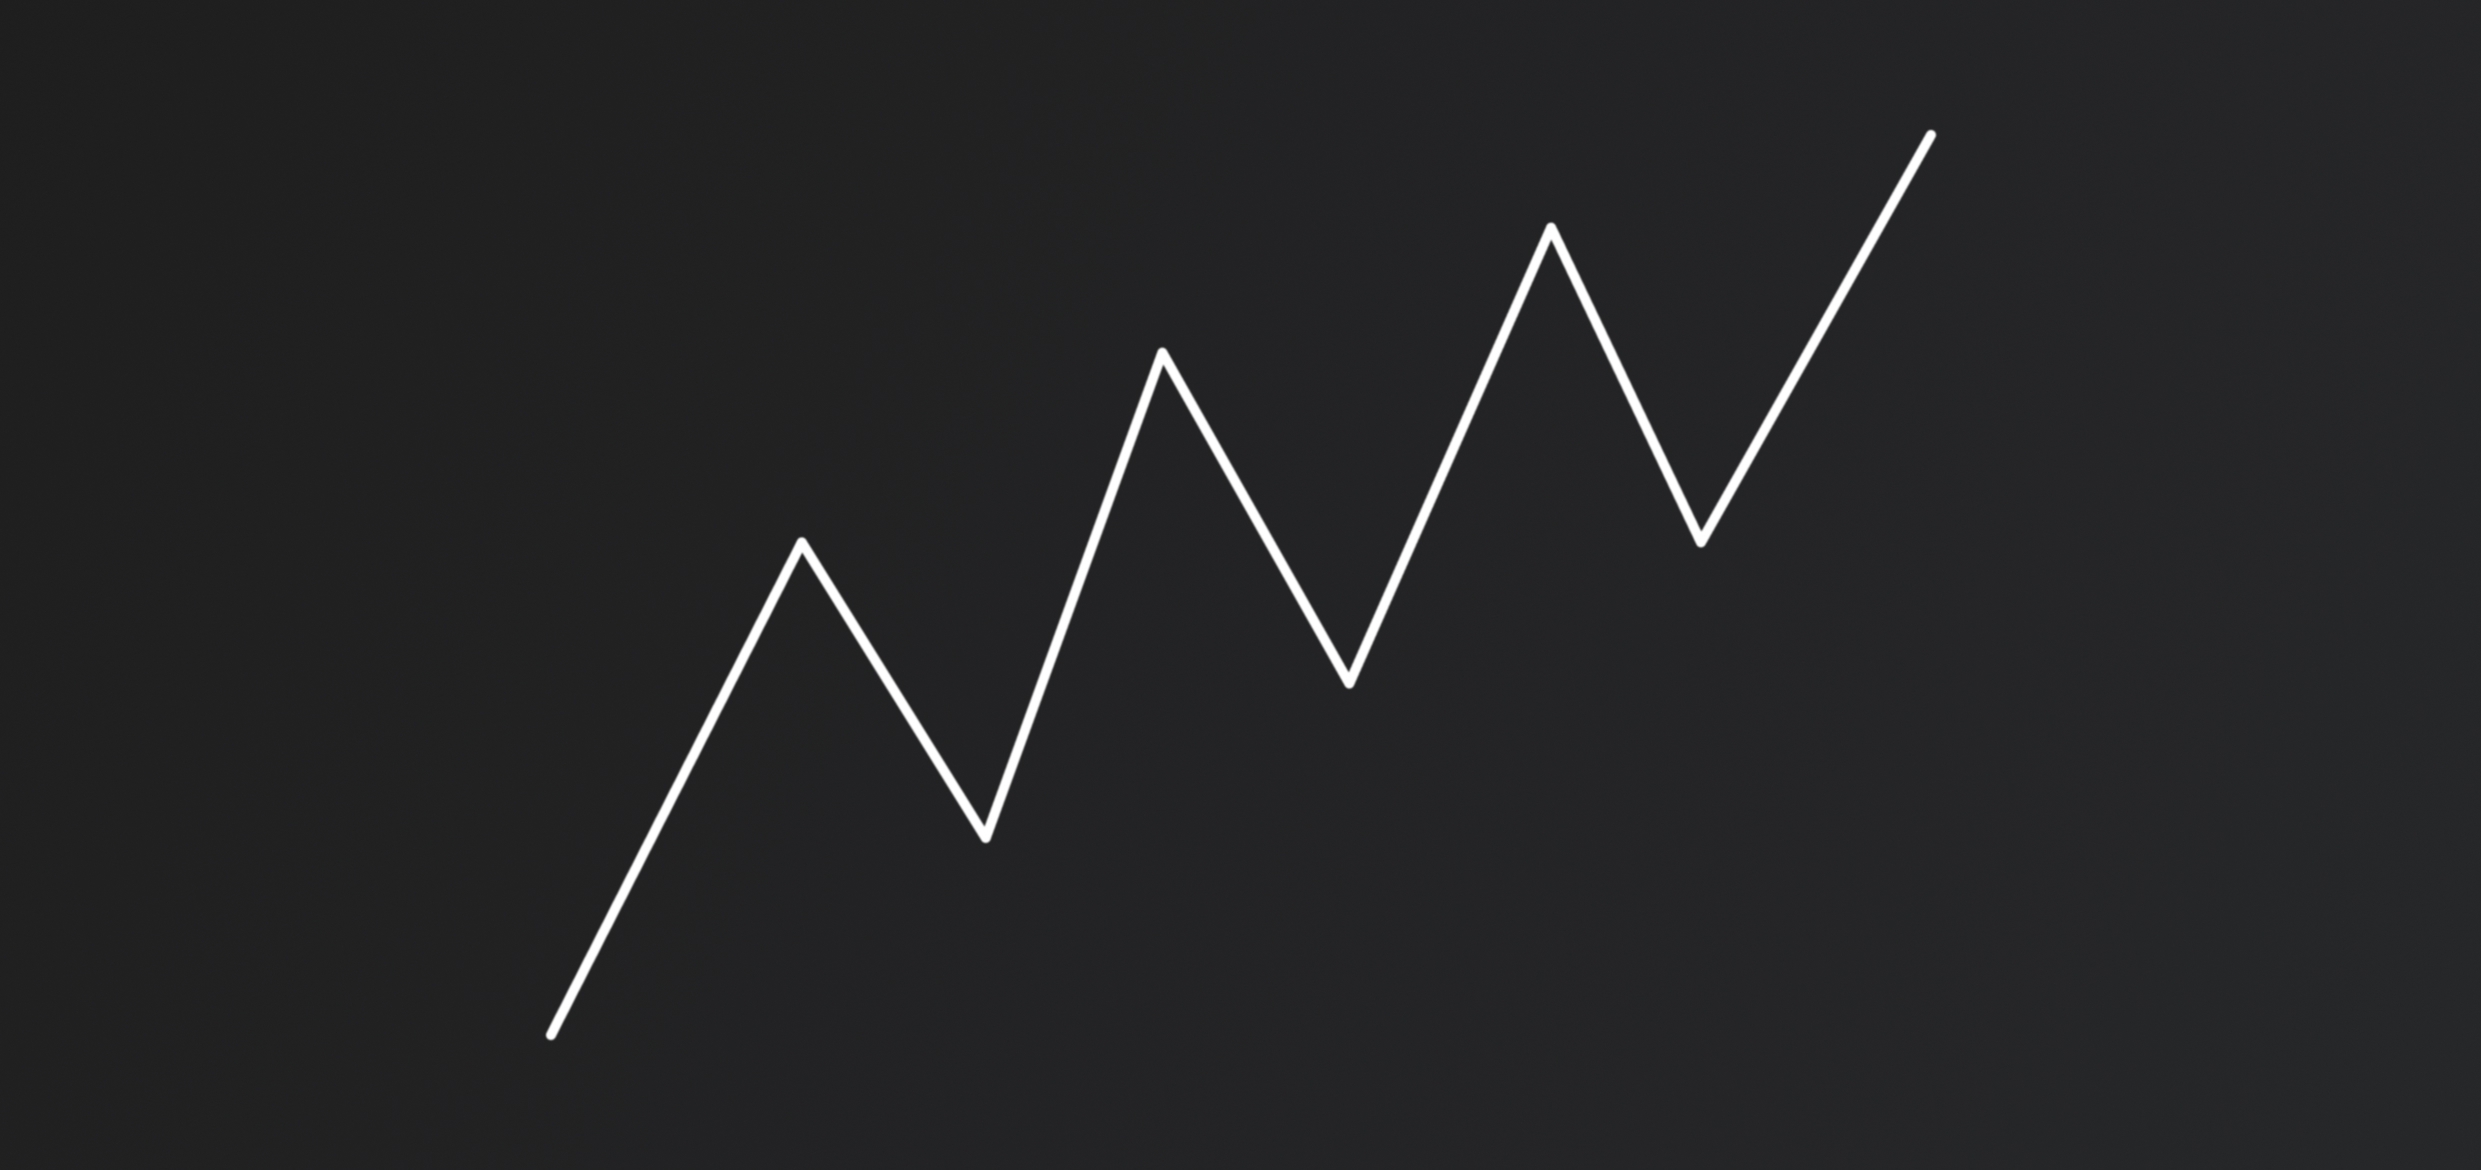
Trends
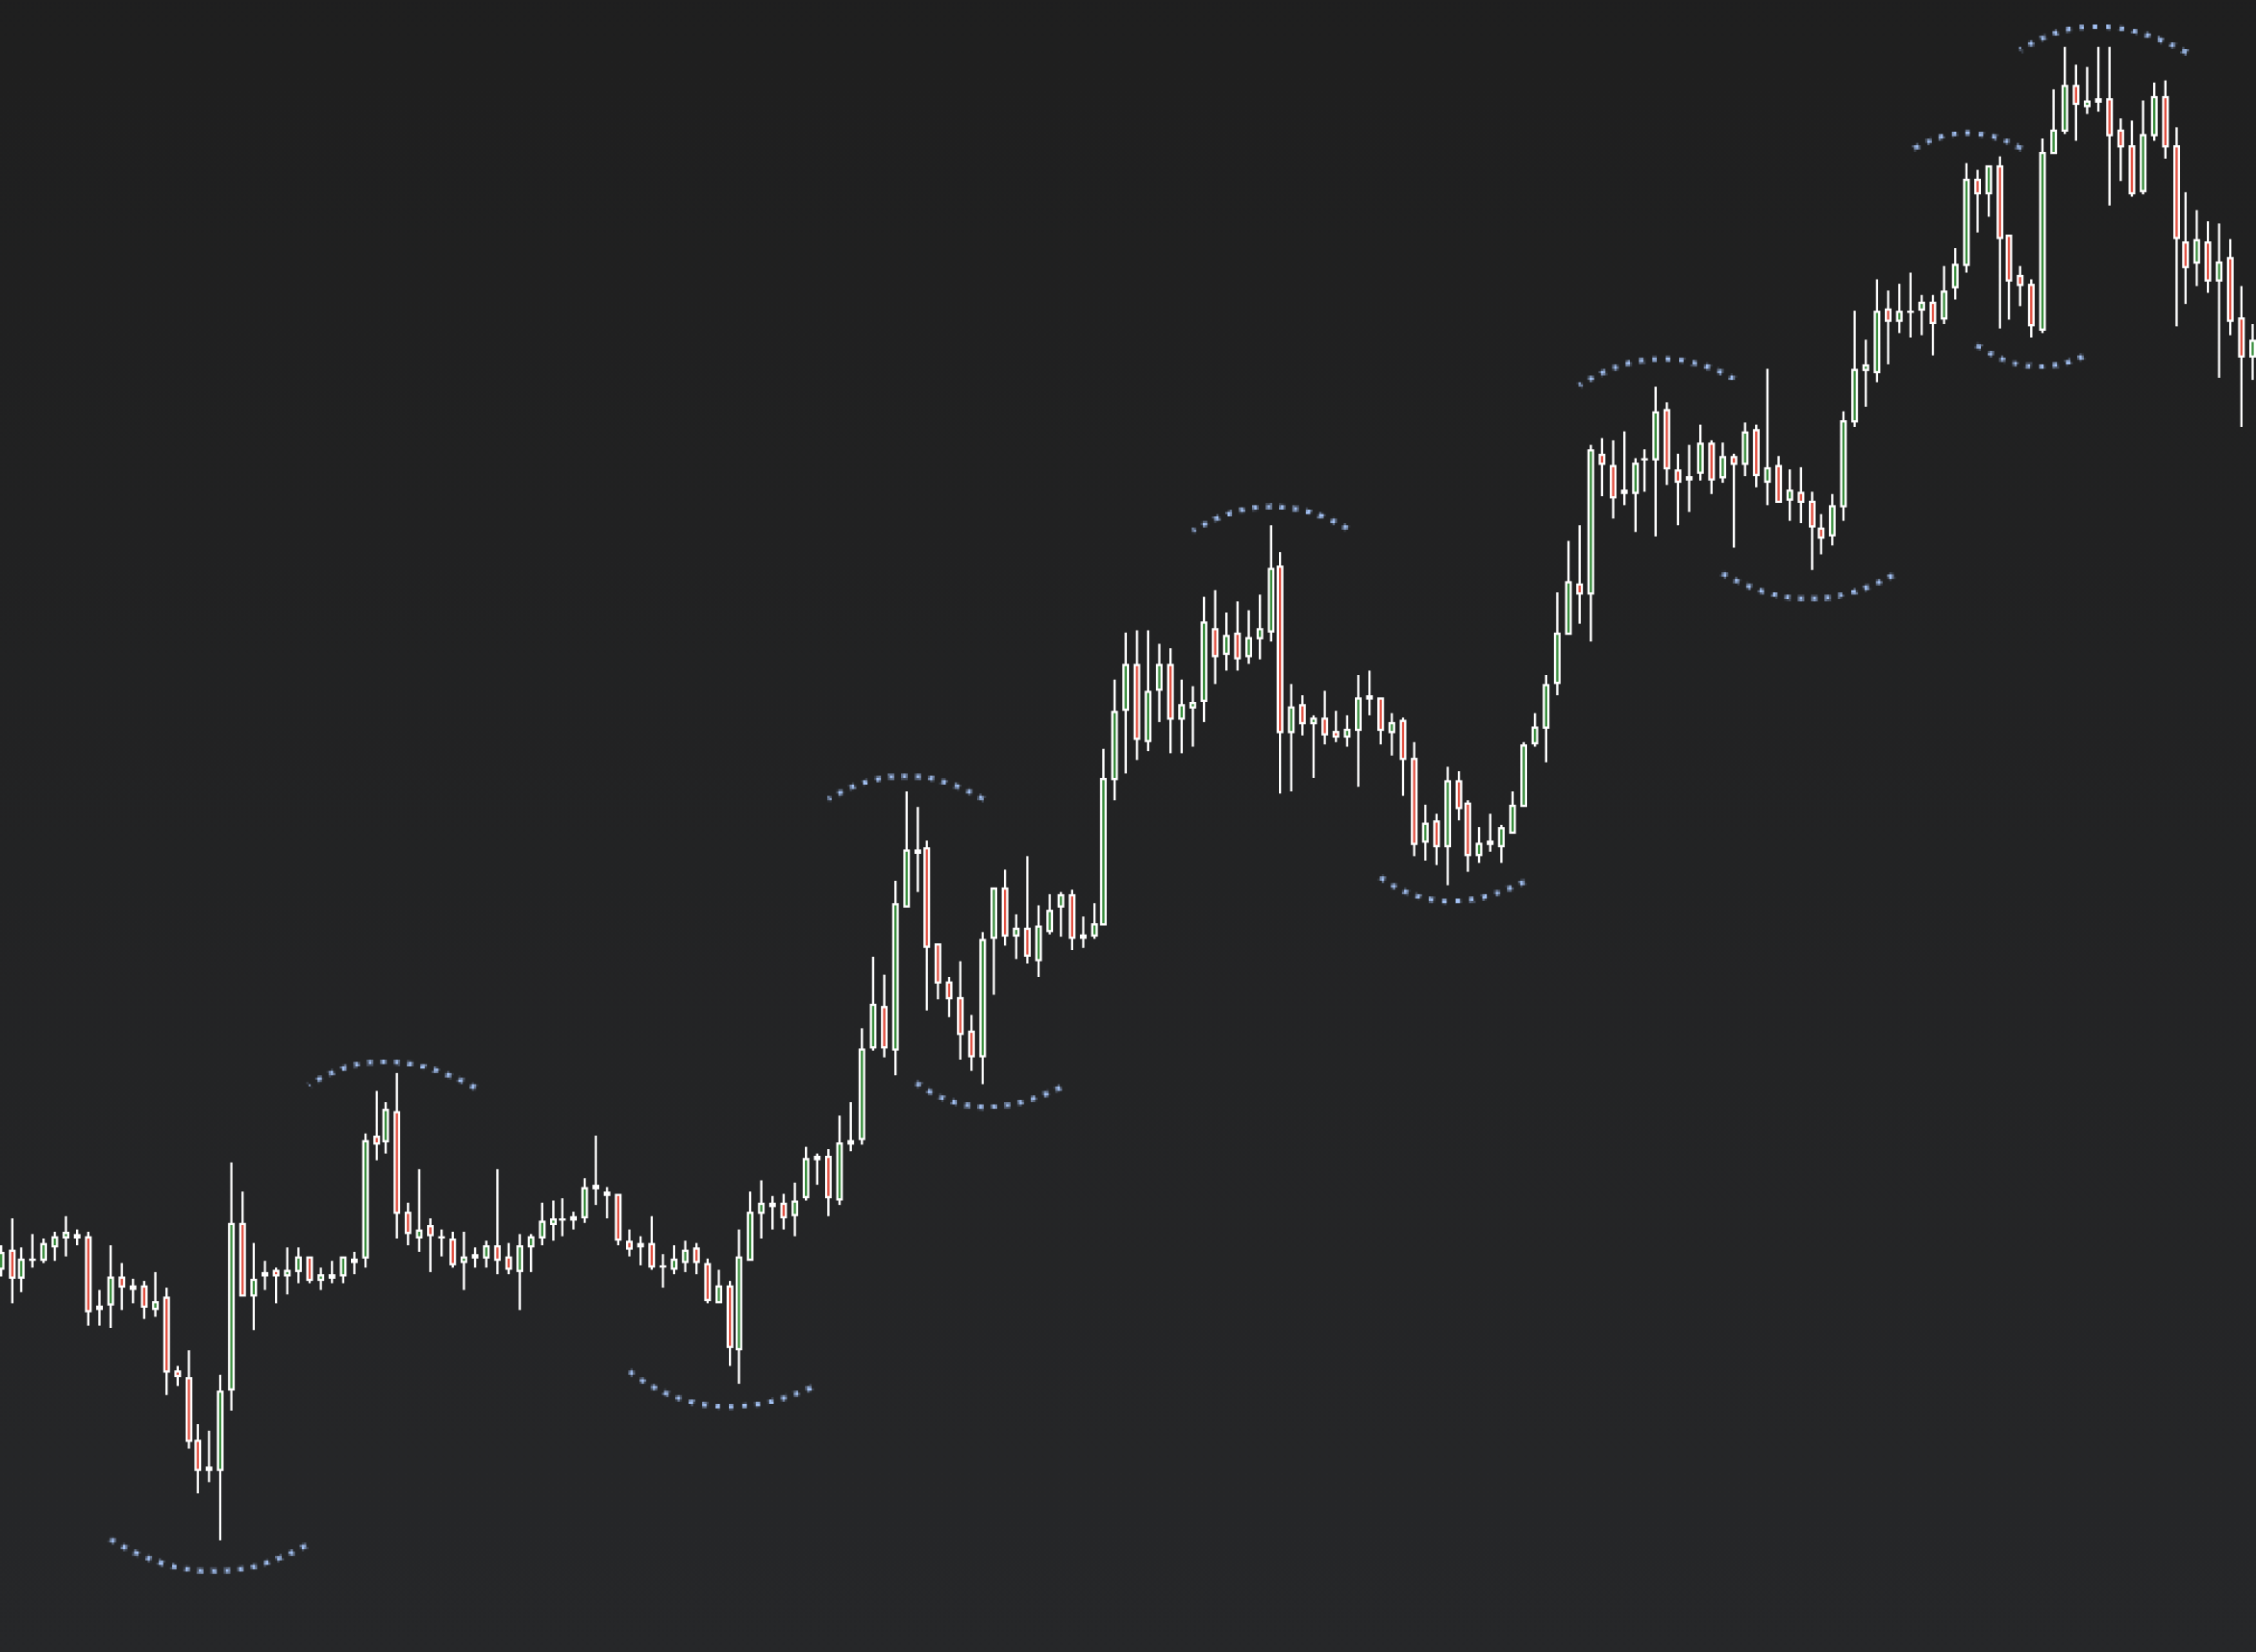
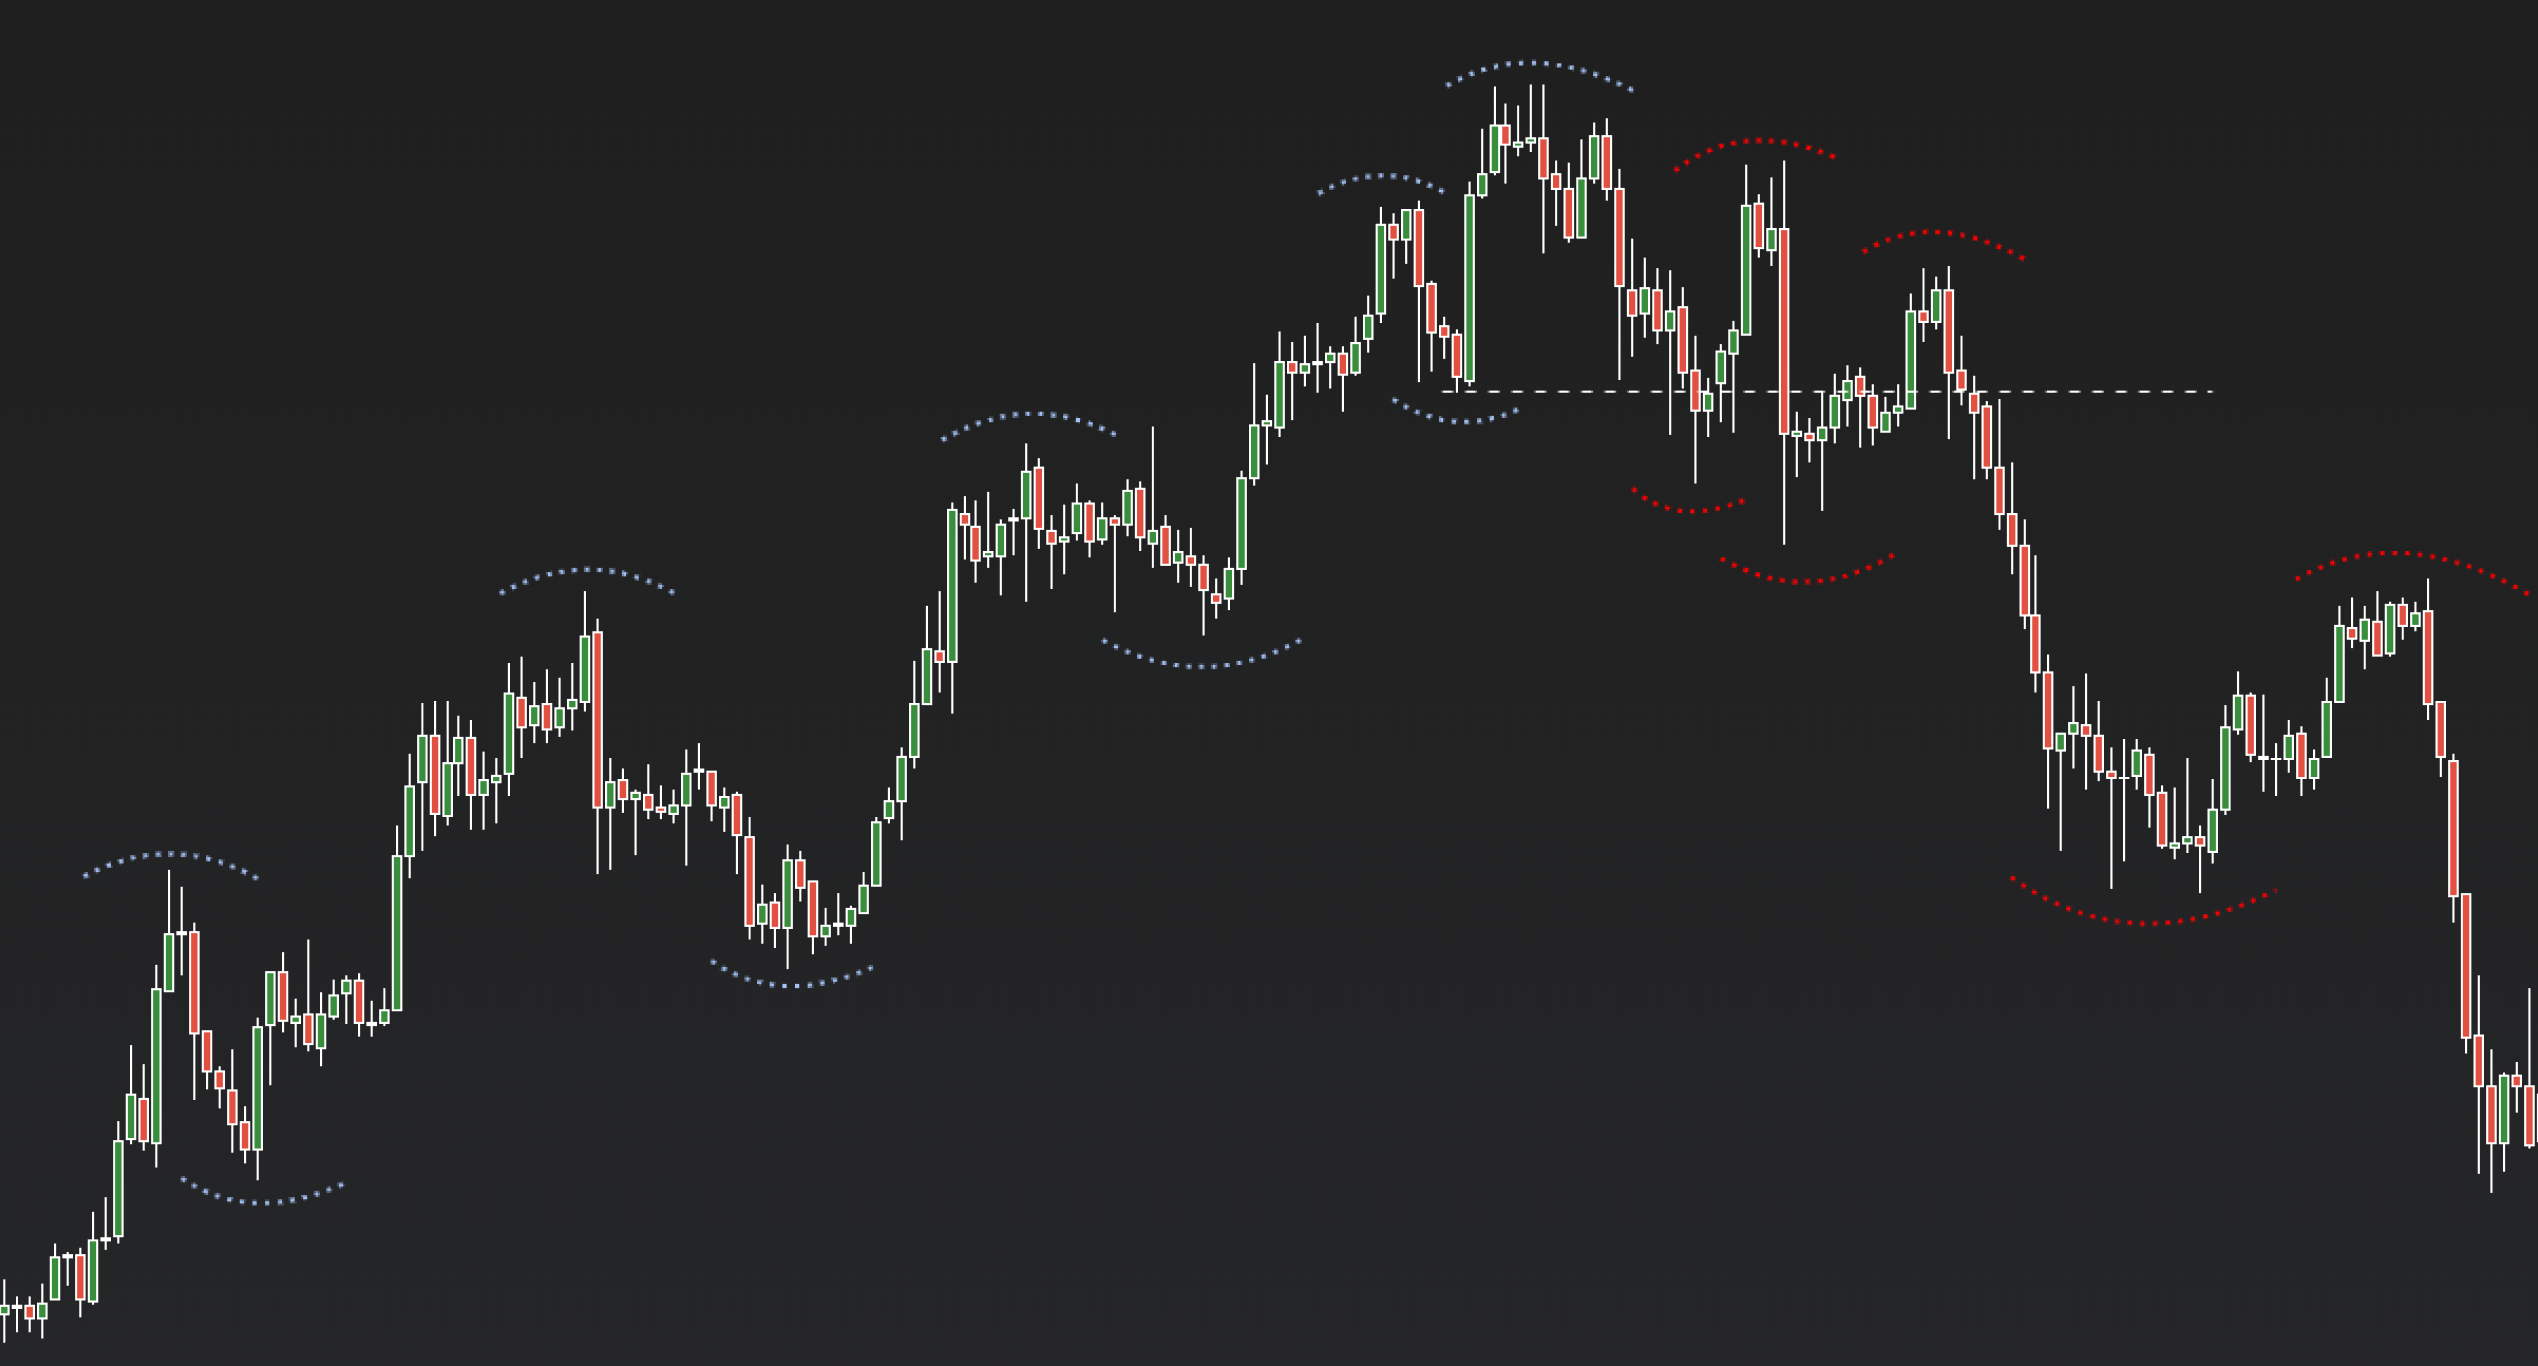
Simply put, the trend is when the price is going either up or down. To give this more technical explanation, an uptrend is represented by higher highs and higher lows. If we look at the chart that shows higher highs and higher lows, we can see that lows and highs are made by a pattern of three candlesticks next to each other.
These are called swing highs and swing lows.
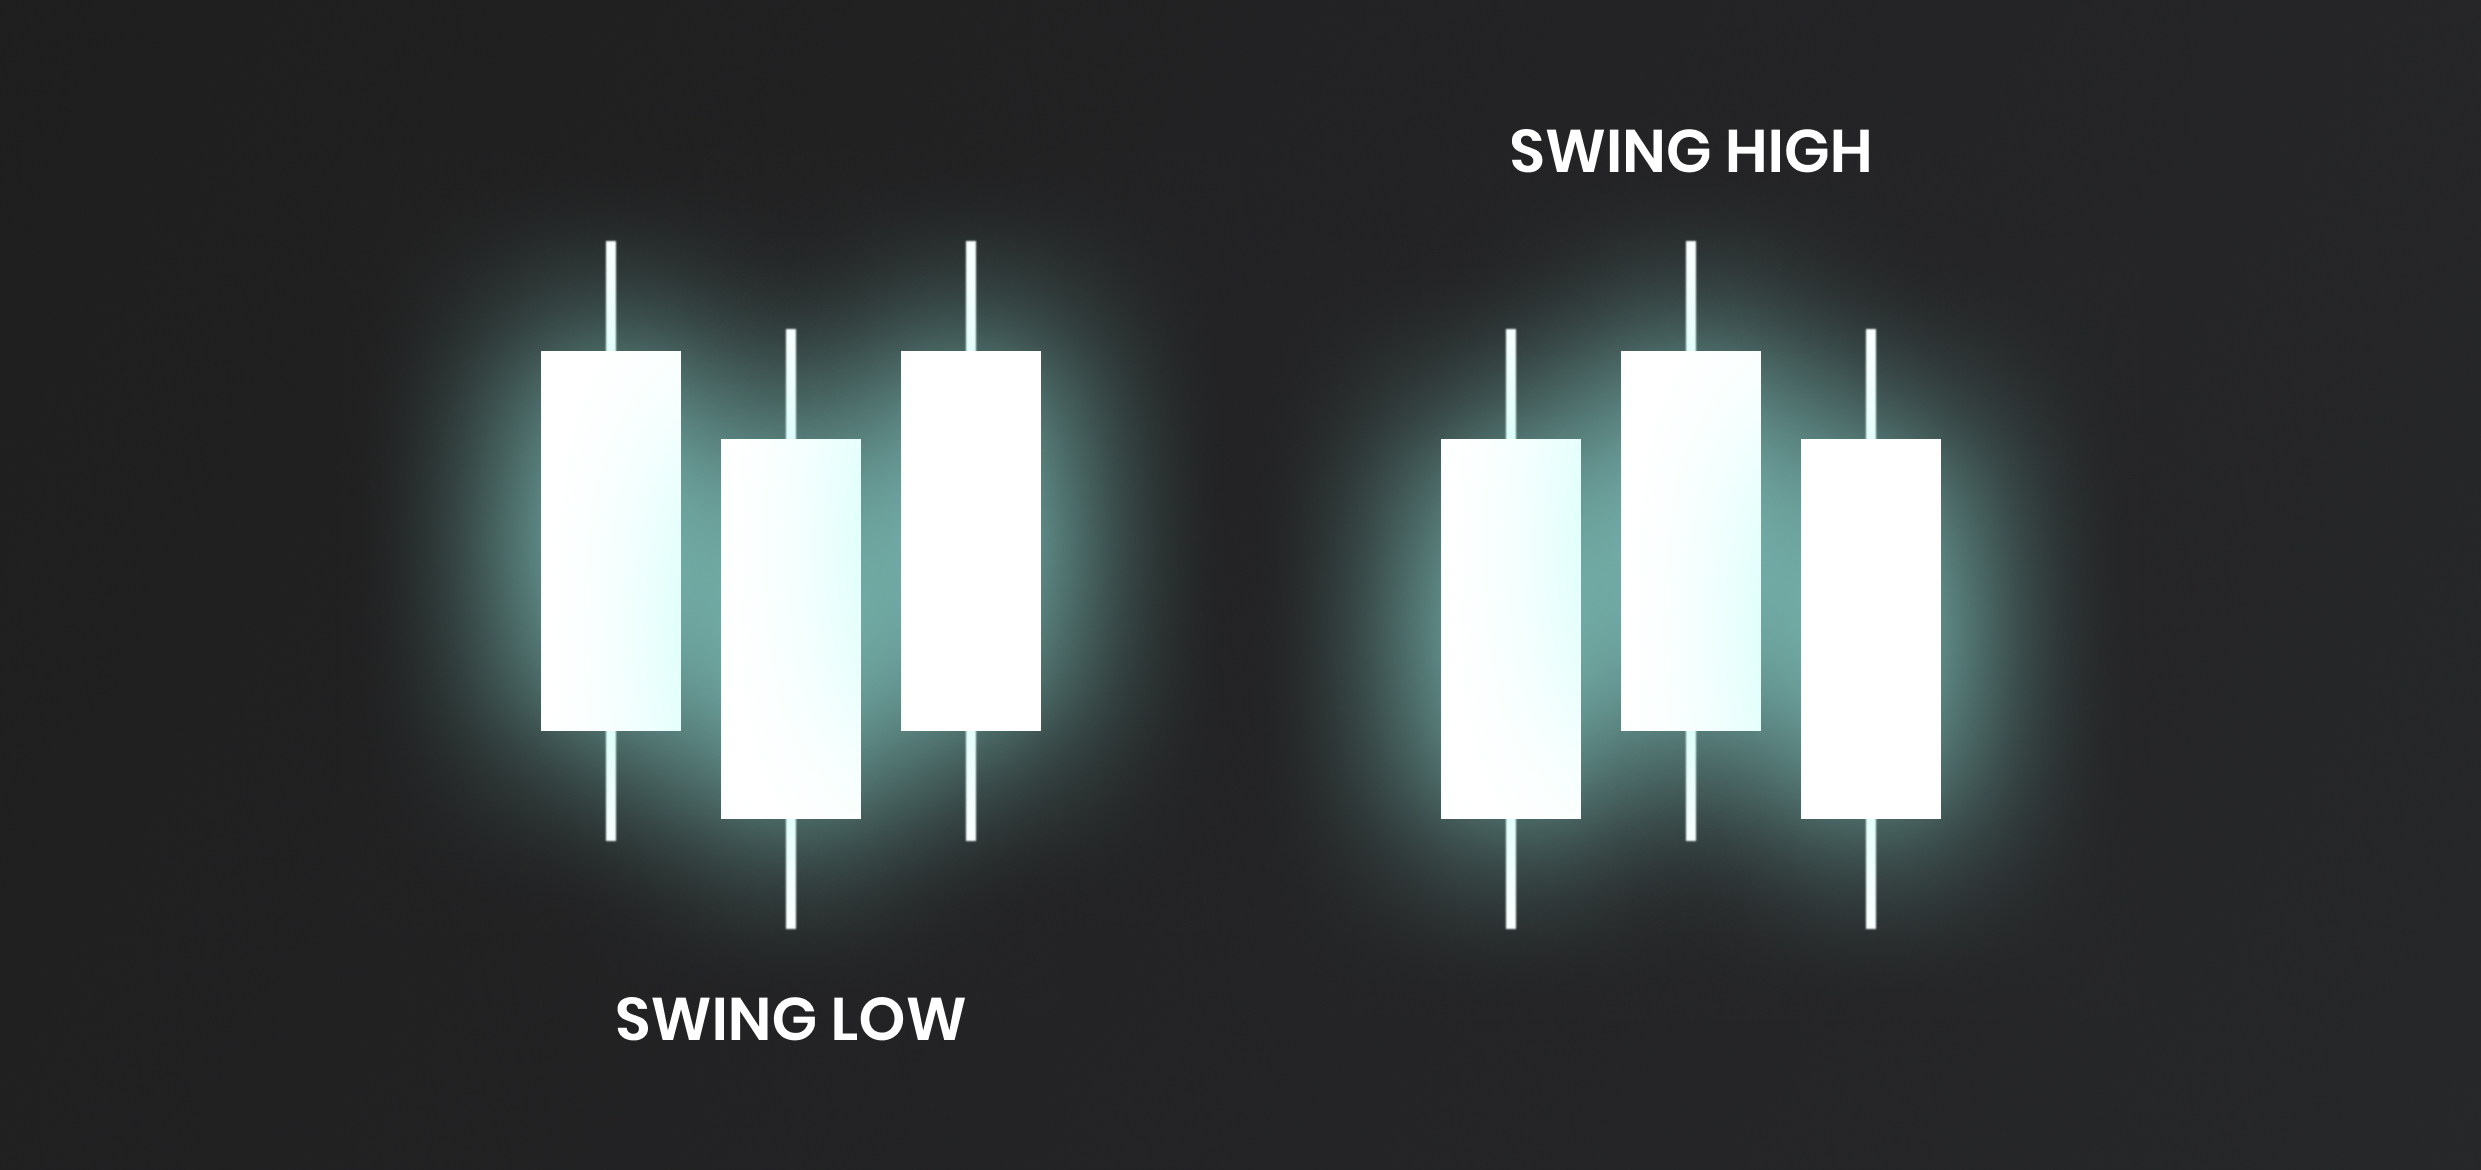
A swing low is made when the price makes a low on the second candle, and the first and third candles are not exceeding that low. The same goes for swing high, which is made when the price makes high on the second candle, and the first and third candles are not exceeding that high. So as we can see in this example of an uptrend, when the price slows down and creates a pullback lower, a swing low is made, and the price moves higher.
Lower lows and lower highs represent a downtrend.
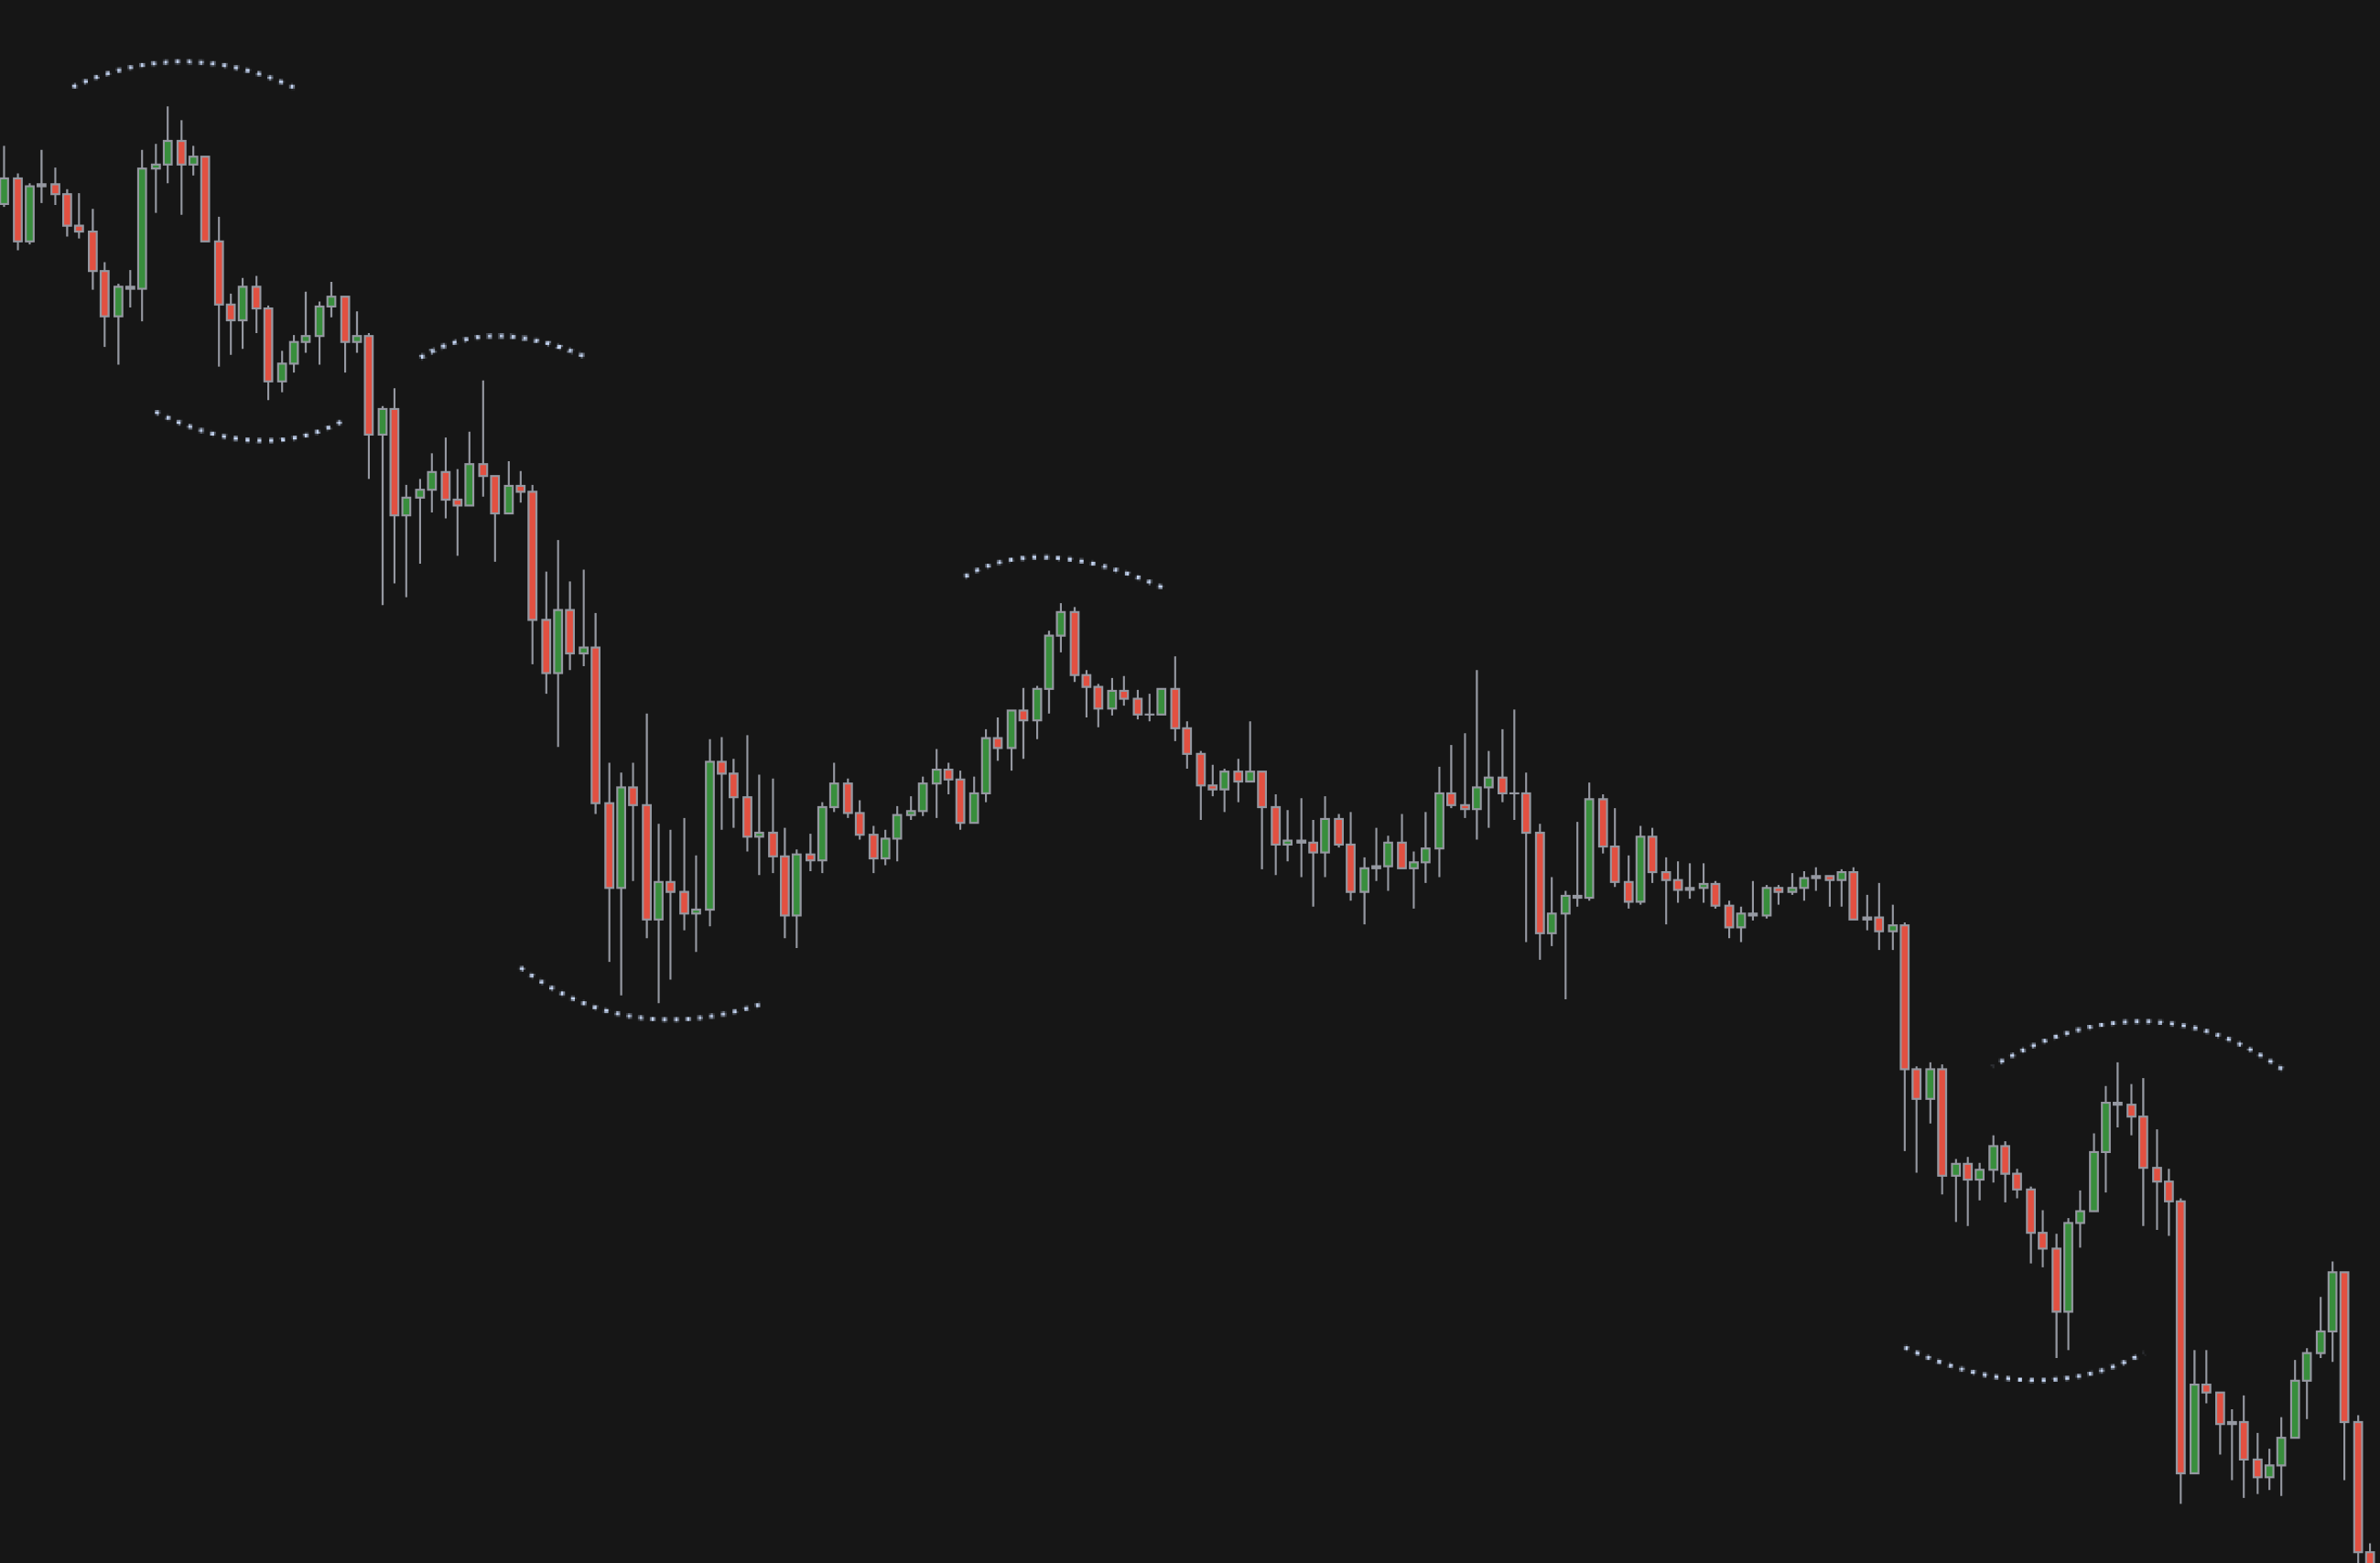
In a downtrend, we look for short-term rallies that create swing highs, which usually offer an opportunity to sell.
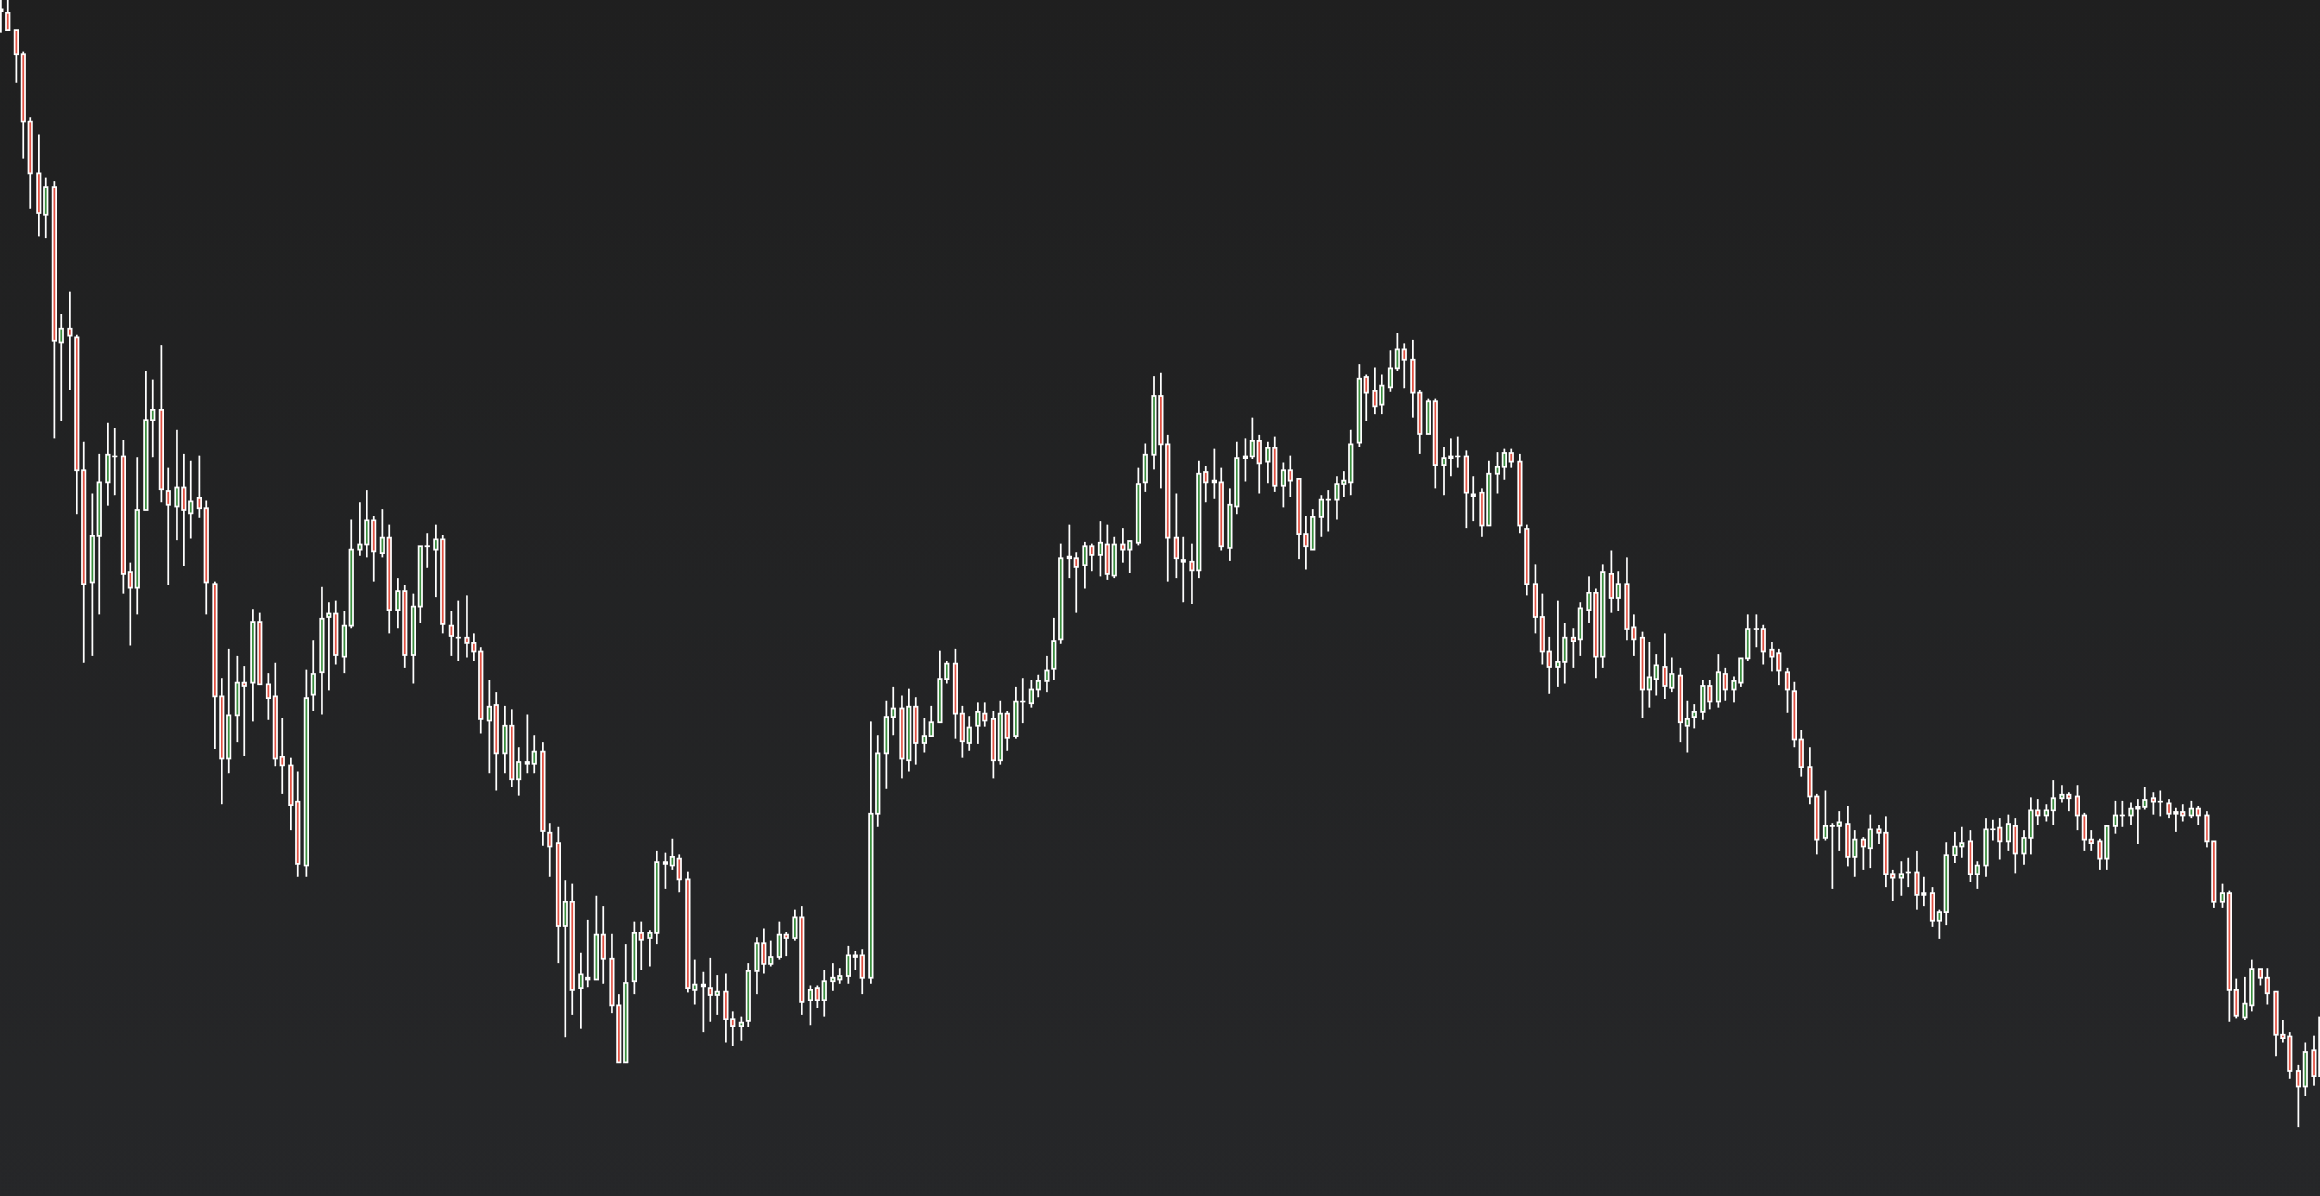
When are trends changing?
If we are in an uptrend and the last swing low that lets to a highest high is broken, we can consider a trend change or at least a pause.
The same goes for the downtrend, if the last swing high, which lets the lowest low, is broken, we can look for buying opportunities or at least a slowing down. Although these examples look very straightforward, things are more complicated in real markets. Swing highs and lows are often violated, yet the price continues in its direction. There are several reasons why this might happen, and it is something that we will cover in future videos. In a trending market, we can use different indicators to help us stay in the trends. The most popular ones are moving averages, Ichimoku cloud, and MACD, and they are used for building different trend following strategies.
Ranges
In ranging markets, price is bouncing between specific highs and lows. The high is acting as resistance and the low is acting as support.

Ranging markets are also called sideways or bracketing markets. When we are in the ranging markets, we are not looking to capture moves but rather use mean-reverting strategies. Mean-reverting strategies work on the assumption that the underlying asset will eventually return to the mean once it deviates from it.
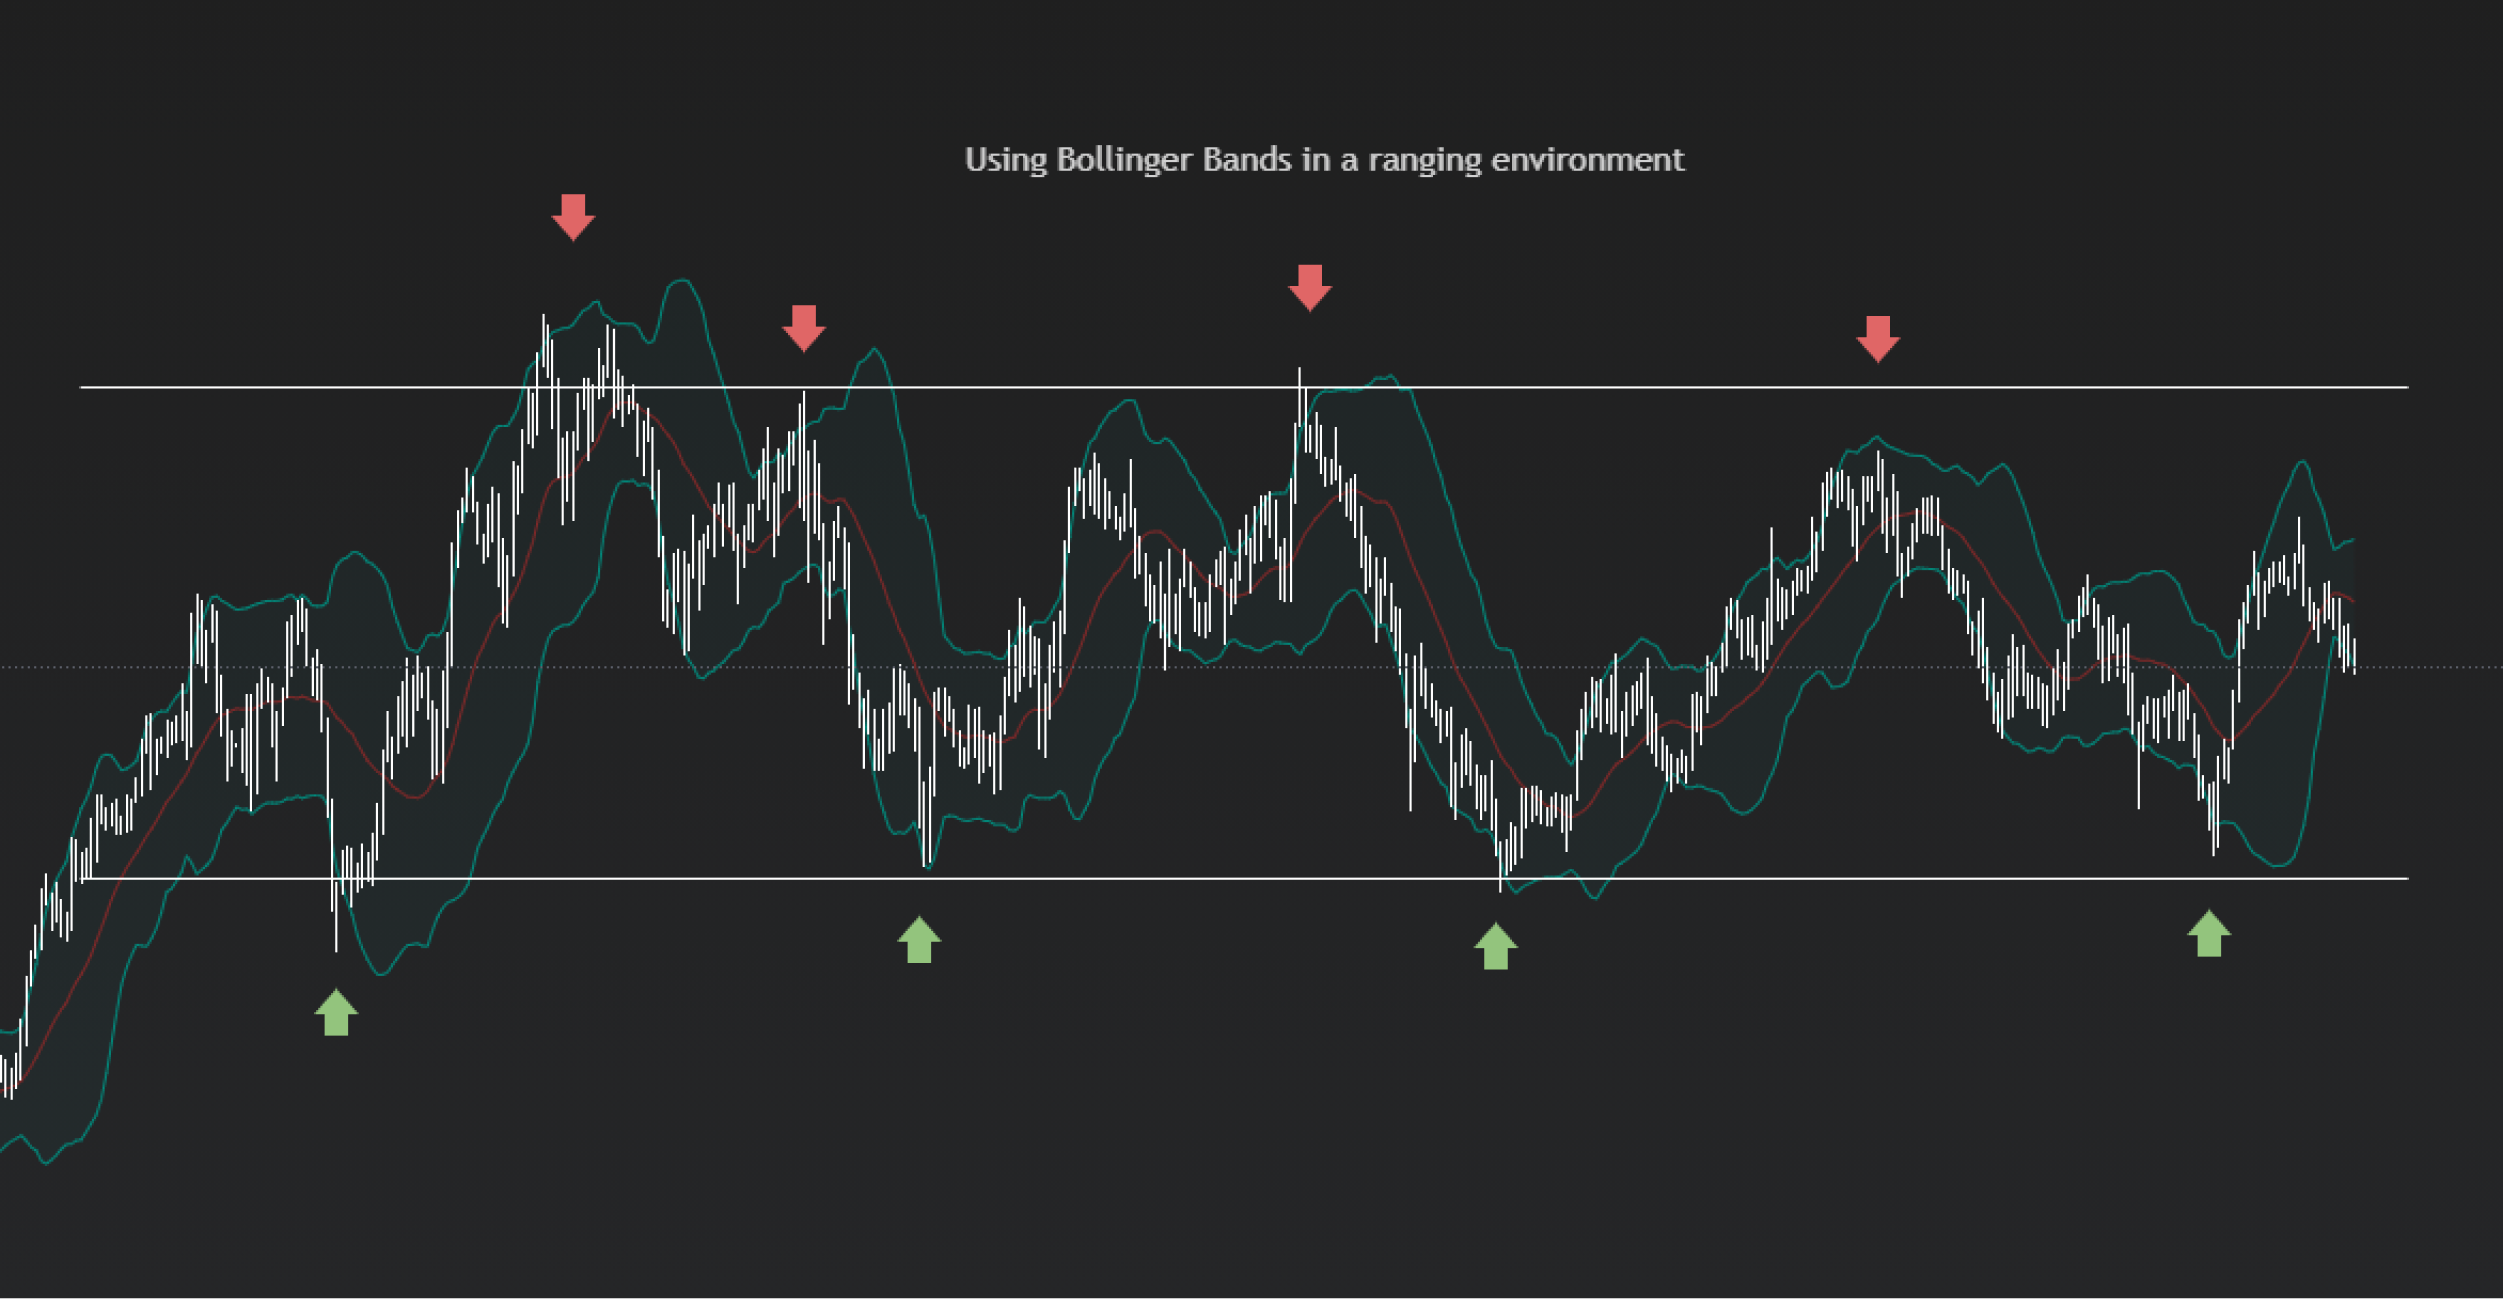
Our mean can be anything, from moving average, volume-weighted average price, or price level. From this mean, we calculate standard deviations. Once the price reaches those standard deviations, we can bet on a return to the mean. The problem with mean-reverting strategies is that the market can start trending, and we will get caught on the wrong side of the market. One of the most popular mean-reverting indicators is Bollinger Bands, RSI or stochastic. So is it better to follow trends or mean-reverting? That is up to you and our personal preference. In general, markets are more ranging than trending, but a lot of money can be made in huge trends.
