Statistical Application
Statistical Application
Statistics are a boring, necessary evil for many traders, but experienced traders know very well how to use them to their advantage. In the next part of our Academy, we’ll take a look at one of our applications that focuses on statistics. Statistics and probability are the cornerstones of technical analysis. For traders who want to achieve consistent results over the long term, statistics are an integral part of their approach to trading. FTMO works diligently to offer all its traders the most consistent and integrated experience. We offer several applications within our Client Area, including the Statistical Application.
The Statistical Application was designed to provide you with user market statistics and useful knowledge about trading symbols or the particular market. When you visit your Client Area you’ll find the Statistical Application in the app menu. The app is divided into two main parts. Market Analysis shows some interesting statistics of all symbols traded at FTMO. In Symbol Analysis you can find more specific information about the individual symbols. FTMO have collected data for the past 52 weeks to provide you with useful market insights to learn how each symbol is likely to behave.
Market Analysis
In the Market Analysis section we share weekly statistics of our symbols. In the first table you will find the most popular symbols traded at FTMO. You can see that XAUUSD is the most popular symbol followed by US30.cash and currency pair EURUSD in third place.

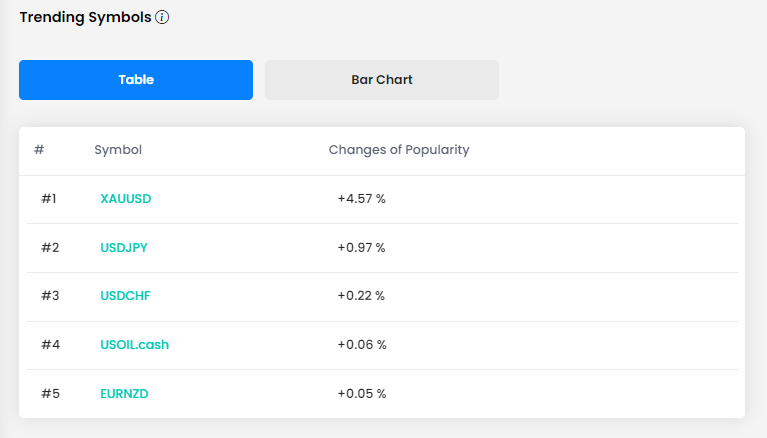
It means that these symbols are predominant in regards to trading volume compared to others. In the Trending Symbols section you can find the change in popularity for each symbol. According to this table, you can see that last week the popularity of XAUUSD increased by 4.57% followed by other currency pairs which are USDJPY and USDCHF.
The next statistics you can find in the market analysis is the highest absolute and relative gain. The gain in this statistics is the increase in price compared to last week. You can choose whether you want to see the highest gains in absolute numbers or relative numbers which measure the percentage change.

The highest absolute and relative gap table measures the difference between last week’s session close and this week’s session open. The difference between the close price and the open price is the gap.

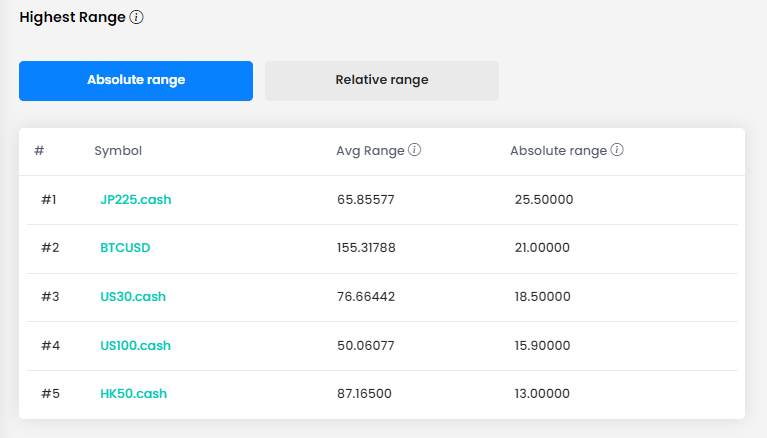
The highest absolute and relative range table measures the difference between last week’s high and low and displays the highest values. A range of a symbol indicates how volatile the symbol is so if you’re looking for some action in the market this table is for you.
At the very end we’ve added a table with some interesting facts about the largest gaps range and gains recorded over the past 52 weeks.

Symbol Analysis
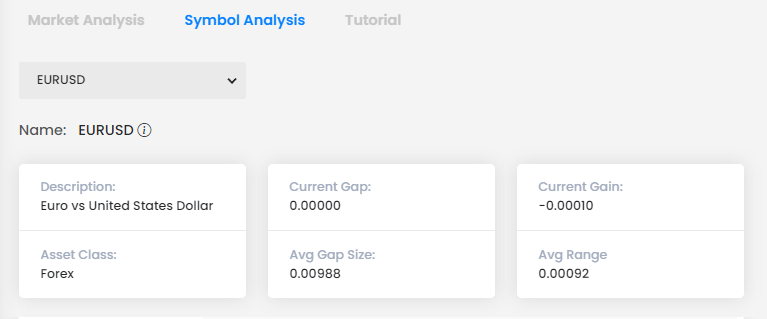
In the Symbol Analysis section you can access a wide range of information of the individual symbol you are interested in. You can find a drop-down box showing all symbols available at FTMO. For each symbol there are several available metrics. Current Gap shows the gap size for the current week. Average Gap Size shows the average gap for the past 52 weeks. Current Gain or Loss is a change in price compared to last week. Average Range shows the average weekly range for the past 52 weeks.
Range Analysis
In the Range Analysis section you’ll find detailed statistics about the previous sessions range of your chosen symbol. This is useful to analyse the volatility of the underlying active. You’ll also find probabilities on how likely the symbol may break out from this range. This is useful to estimate whether the symbol will remain in a range or break out of range.

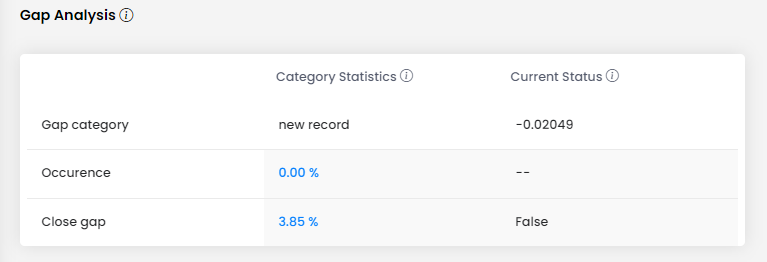
Lastly we have included a Gap Analysis, which shows you gaps of symbols on a weekly basis. Holding trades overnight or over the weekend can be very risky and if you are not sure what the risk of holding that asset can be you can check the Statistic Application for the average gap values.