


Support and Resistance
In this lesson, we will look at one of the most popular trading strategies that are part of many trading systems used by traders worldwide.
Support and resistance
So what is support and resistance trading?
If you ever saw support or resistance drawn on the chart, most traders use straight or diagonal lines to do so. But this might not be the best representation, as support and resistance do not represent exact price points but zones. Why do they work? Simply because they are visible to a lot of traders and trading algorithms. So, when the market reaches those zones, there will be a lot of participation.
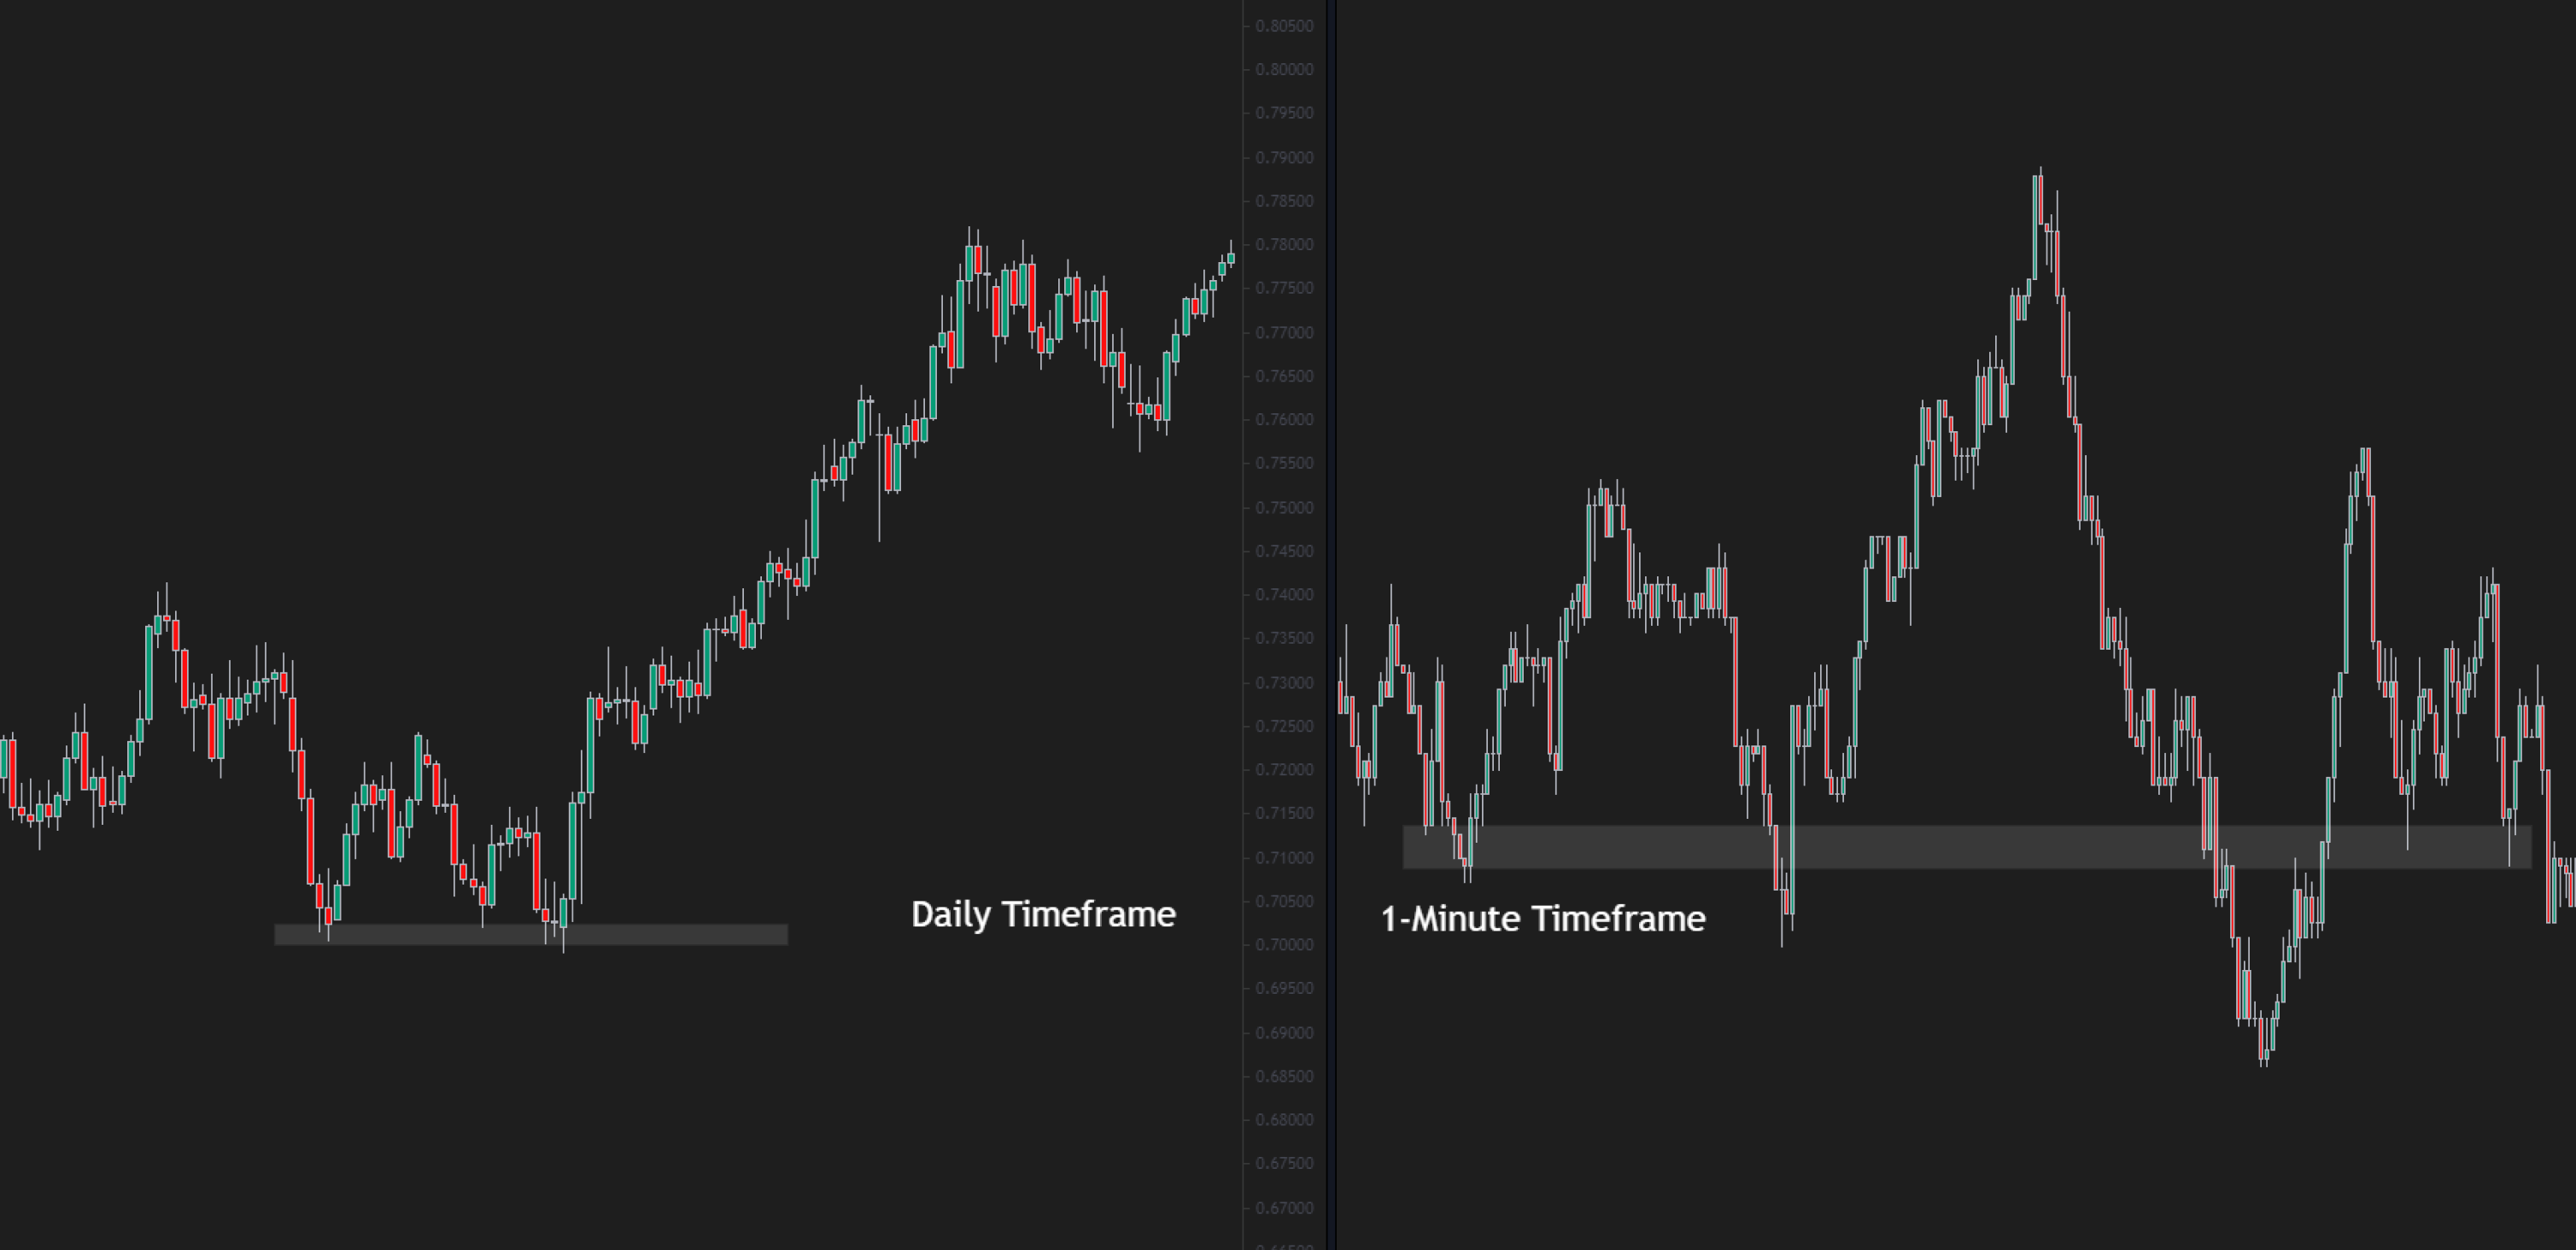
This is why higher time frames support and resistance zones, like those at four-hour, daily or weekly, will play more significance to price movement than one-minute or five-minute SR zones. We can think about resistance as a ceiling above the price and support as a floor below the price. Both of these hold the price until they are broken. The common misconception that you might read before is that support and resistance zones are stronger with the number of touches they have.
This is not true, and it is due to the fact that traders place pending orders at those levels and with more and more touches, these pending orders get consumed, so the market has an easier and easier path to break through eventually.
Horizontal support and resistance
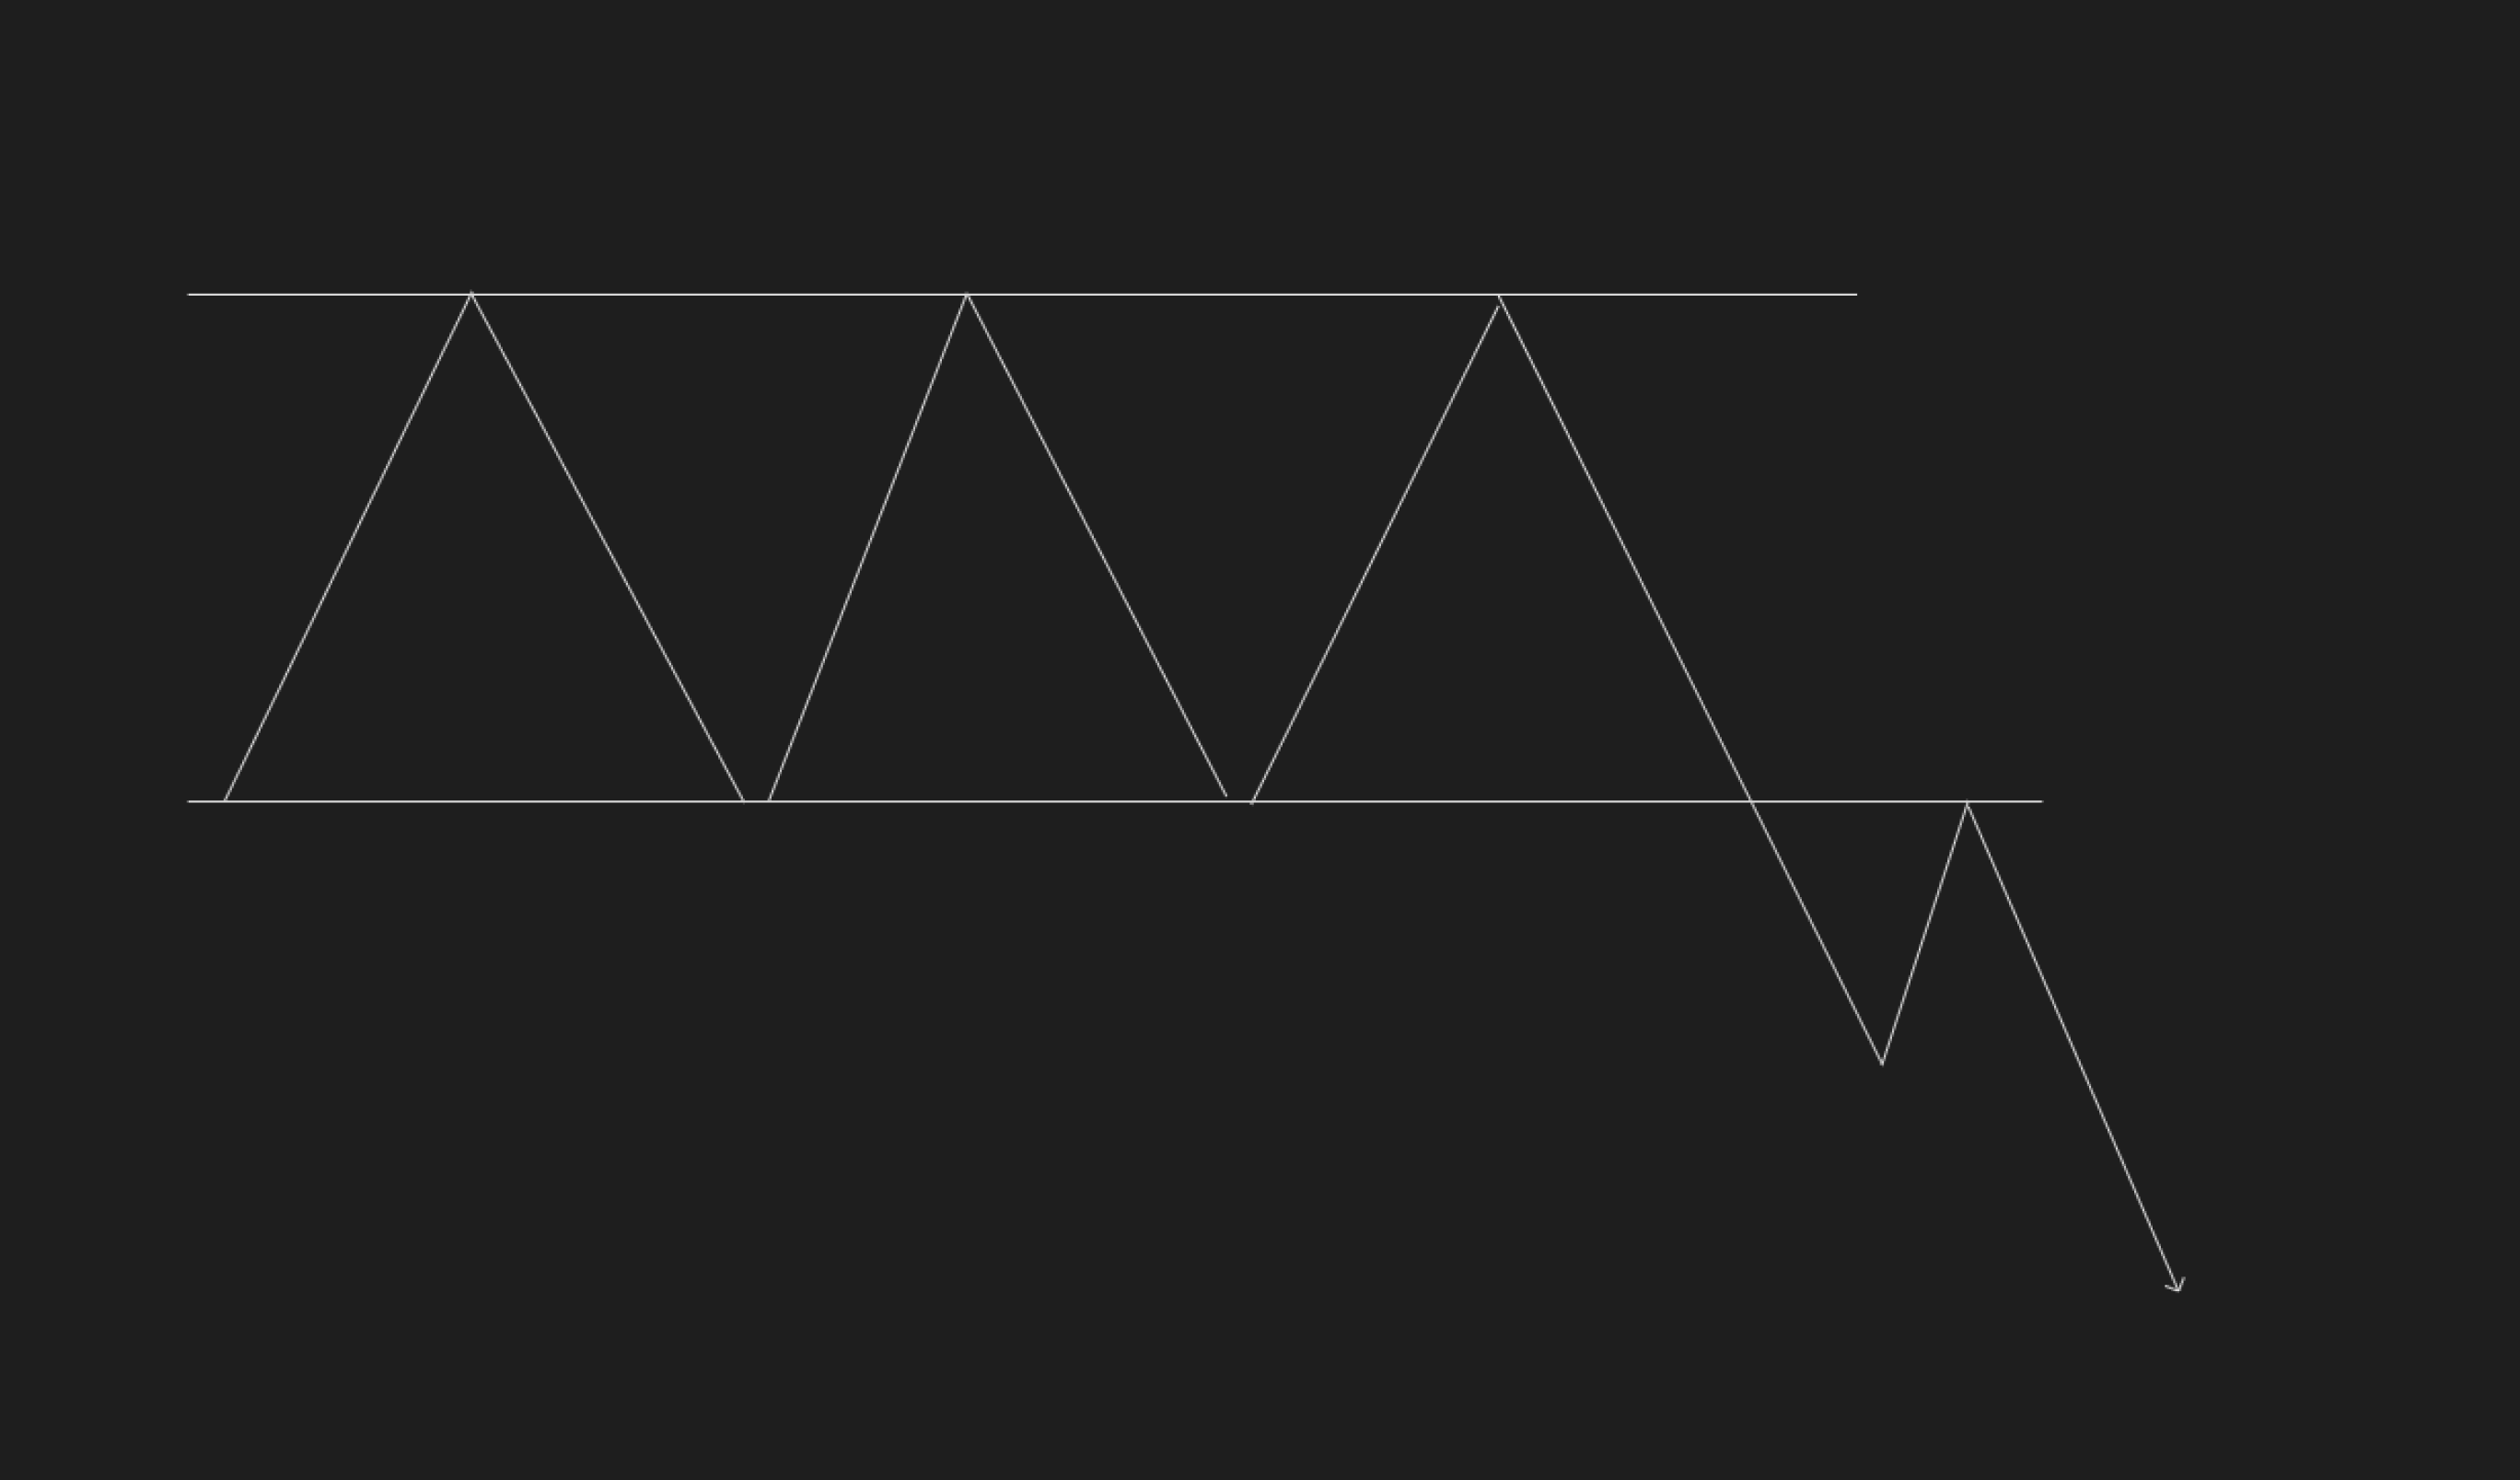
Marking out horizontal support and resistance is the most popular price action trading strategy, which can be used in both ranging and trending environments. When we are looking to trade support and resistance, there are two situations we might find ourselves in. The first is trading them from the same side, in other words, we are buying support and selling resistance. In this case, we don’t want to trade zones that have too many touches. We have to bear in mind that if the price revisits the zone for a second or third time, there will be a lot of resting orders, above resistance and below support, from traders who are either already in the trade with their stop-loss placed above or below. But also breakout traders that anticipate levels to break. Because of that, markets often tend to probe these areas, causing both traders to stop out from their positions and trapping the breakout traders. We should always be mindful of this when we are placing our orders.
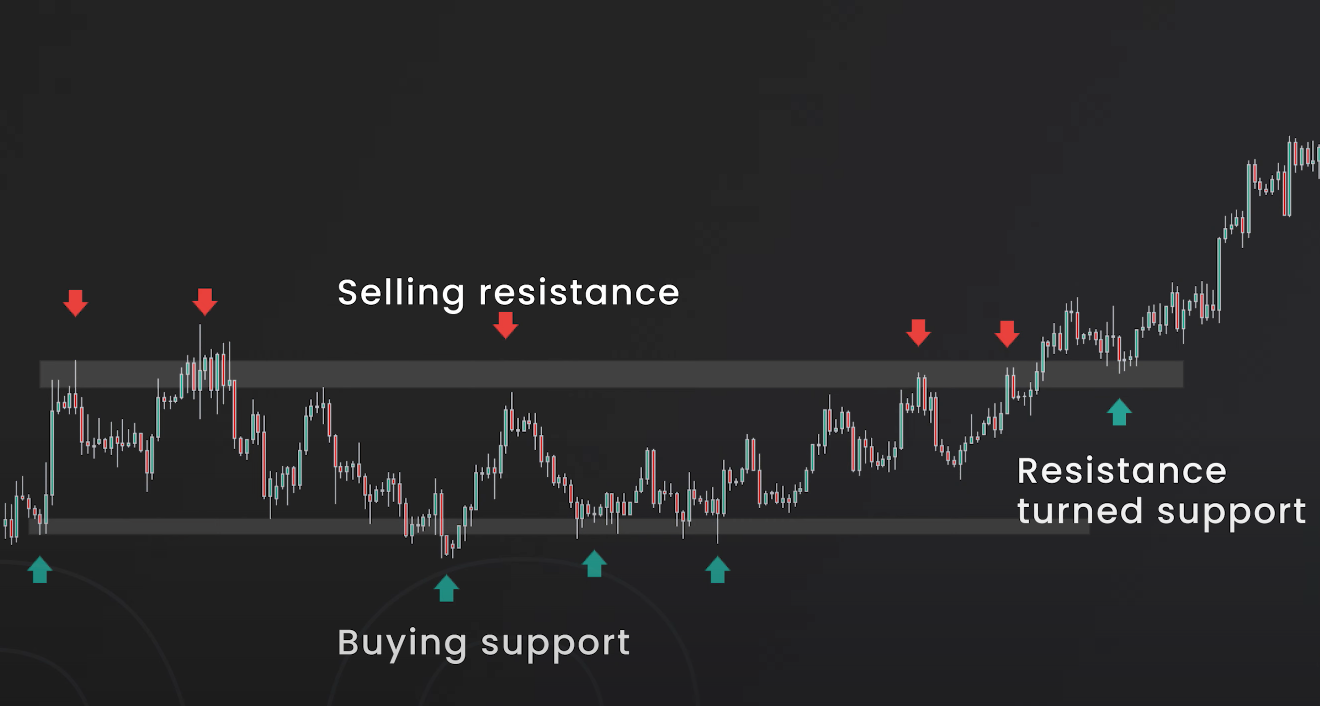
The second type of horizontal support and resistance trade is when we are trading the inverse of a level. This means that we are going long on prior resistance and going short on prior support. With these trades, the more touches the level had before it flipped, the more significant it is. So, in other words, if we are going long on a level that was previously a resistance with four touches, it will be much more significant than a level with two touches. When we are marking the support and resistance on our chart, we should always start with the bigger picture on higher time frames like weekly or daily and then progress to shorter-term time frames. Other price points that can act as significant support and resistance levels are round numbers, pivot points, and opening prices of a new weekly, monthly or yearly candle.
Diagonal support and resistance
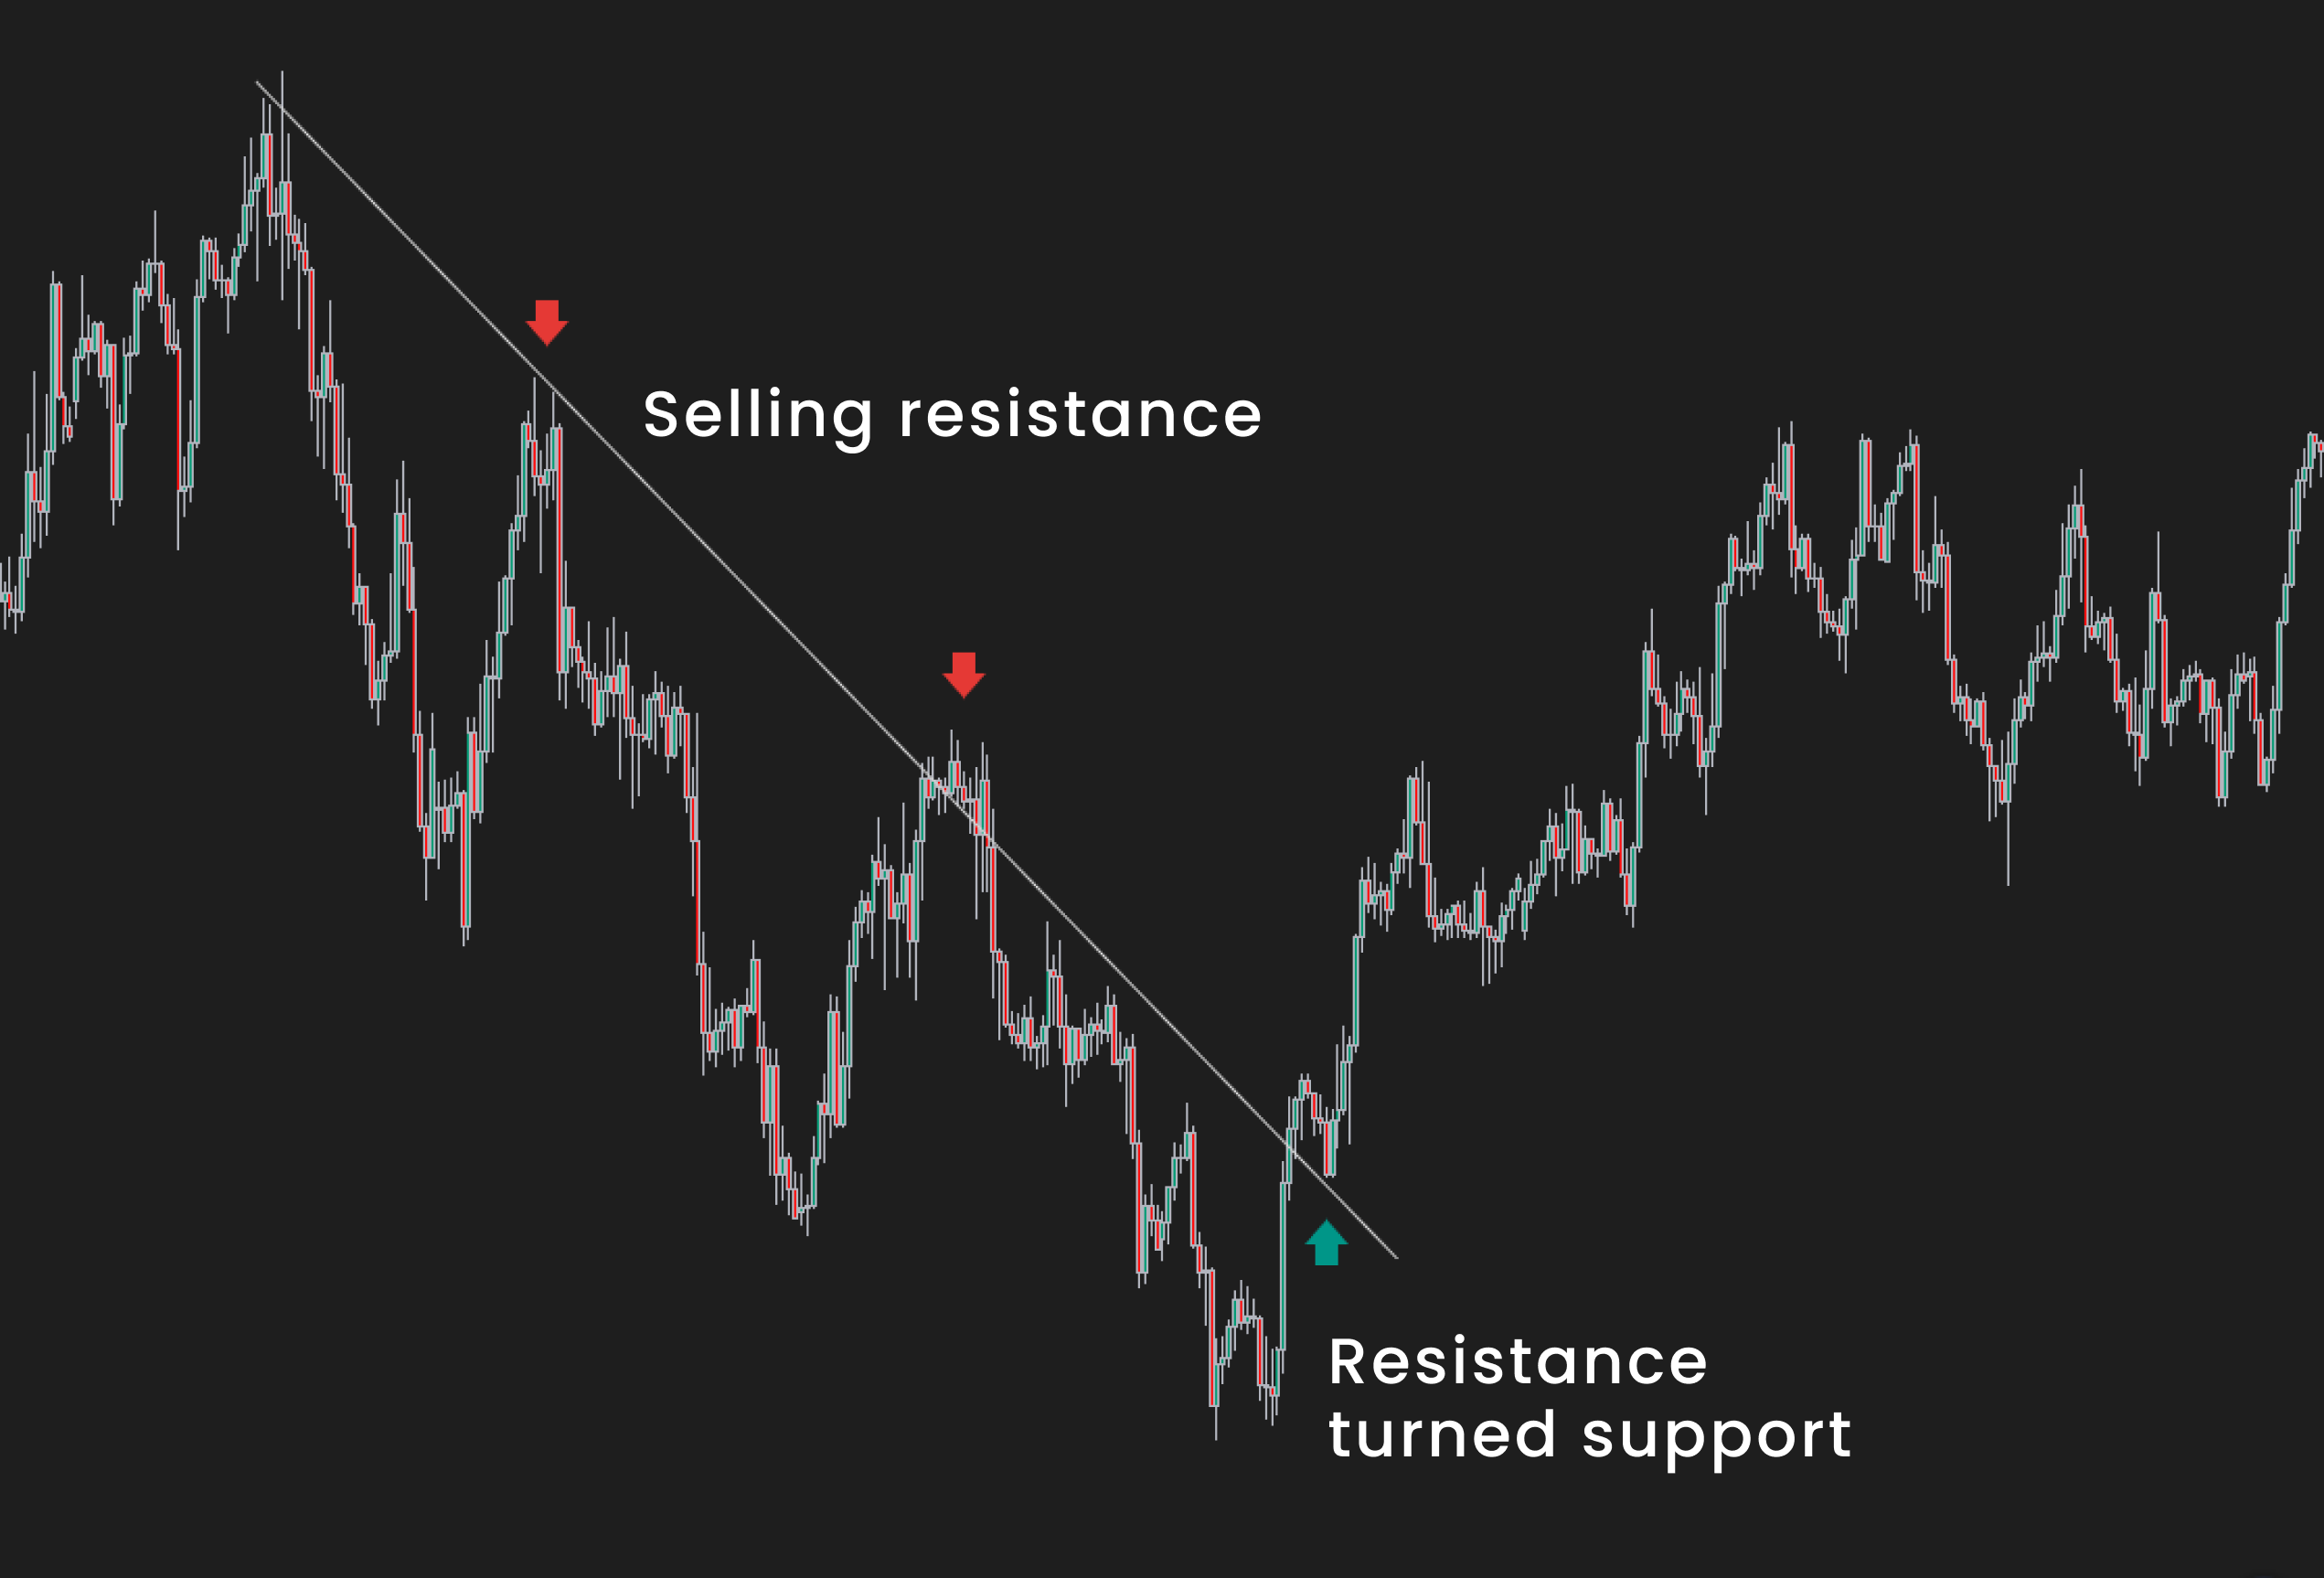
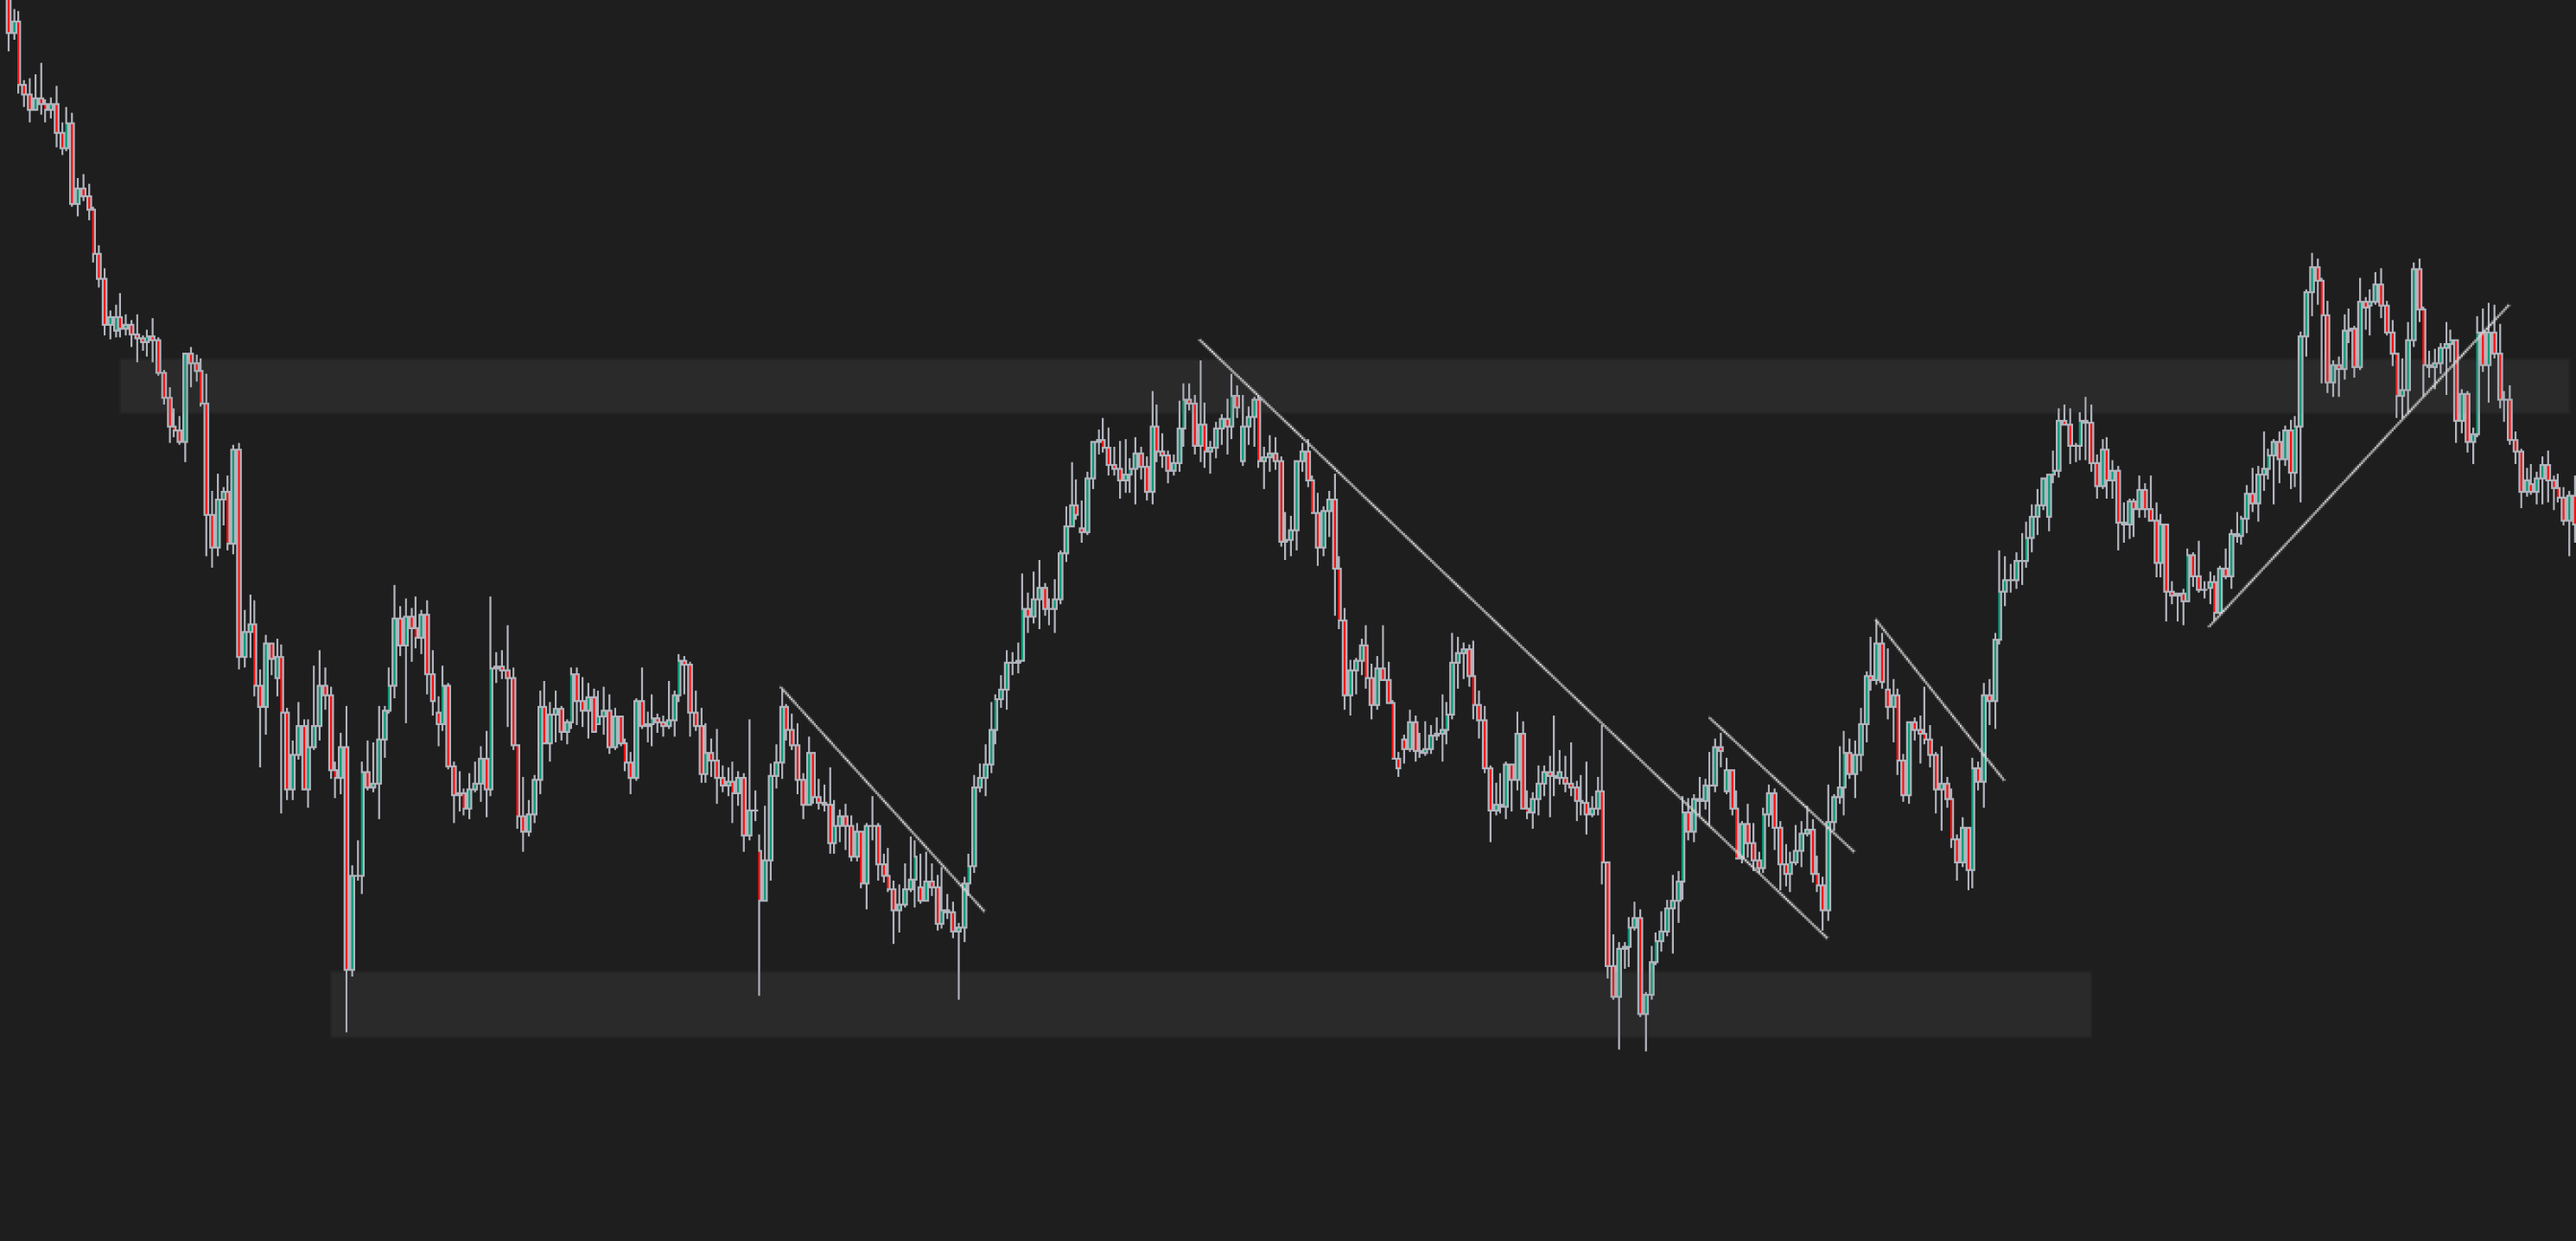
Diagonal support and resistance, also known as trend lines, are commonly used among traders. Compared to horizontal levels, they can be more subjective as they can be drawn by connecting two or more price swings. When we are drawing trend lines, we should always focus on the most apparent levels that show a clean path of ongoing trends. Like the horizontal support and resistance areas, these can be traded from the same side and inverse once they break. The more touches the trendline has, the weaker it becomes and is more likely to break. We can also use trendlines during pullbacks in trends as a guide when pullback might be over, and we can continue the trend.
Dynamic Support and Resistance
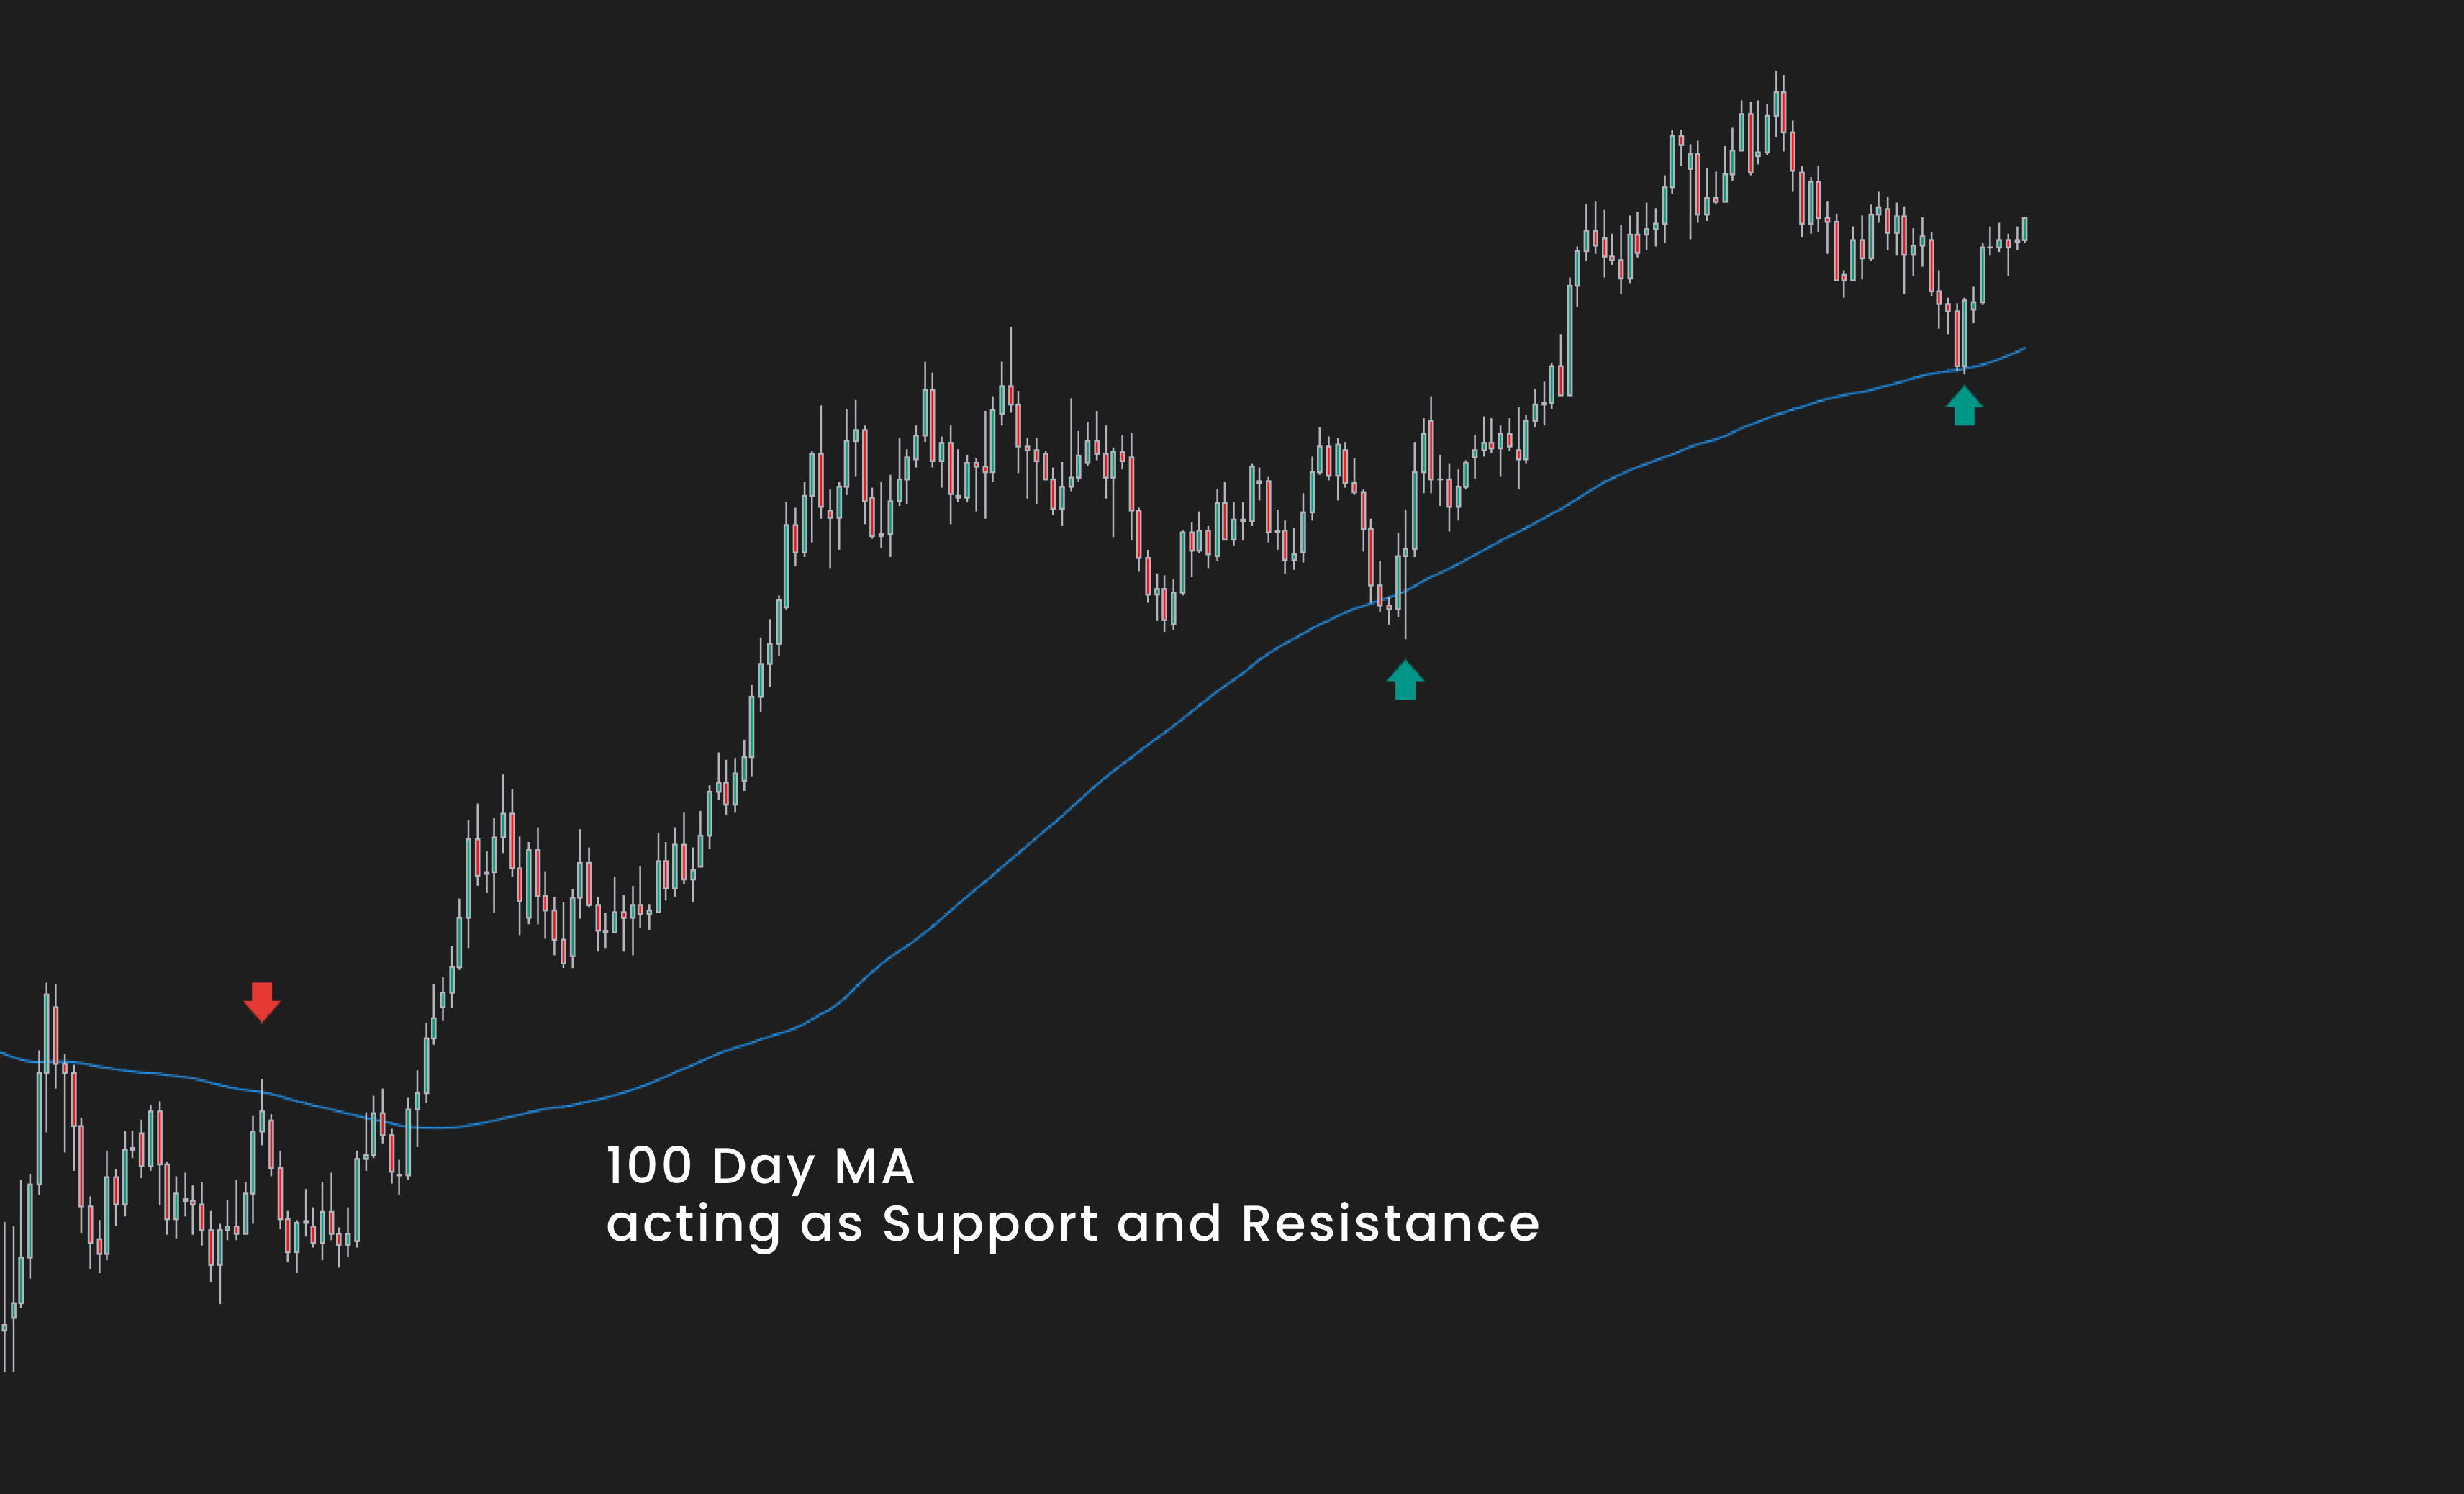
The last support and resistance levels we can plot on our chart is a dynamic one. These come from different indicators, with the most popular ones being different types of moving averages. The most common ones are fifty, one hundred, and two hundred moving averages that are plotted on daily and weekly time frames. Many traders and investors watch these, so we can assume that prices will react to them once they are tested. Other dynamic support and resistance indicators are the volume-weighted average price, Bollinger Bands or Ichimoku cloud.
