


Technical, Fundamental, Sentiment and Statistical Analysis. Which one is best?
There are two types of analysis that we know, technical and fundamental analysis. Those are the most popular that traders use either together or separately. Besides that, there are two more types of analysis that are not so often talked about, sentimental and statistical analysis. We are going to cover all four of these and take a look at some pros and cons of them.
Technical analysis
Technical analysis is based on historical patterns and behaviours of given instruments. When traders use technical analysis, they look at historical price development and, based on that, decide possible future price movements. One of the key arguments of technical analysis is that tools such as support and resistance, Fibonacci numbers, pivot points or moving averages are watched by many investors, so the price levels attract a lot of supply and demand. But because no two traders in the world are 100% the same, technical analysis tends to be very subjective. As we already mentioned, there are a lot of different tools and patterns traders can use. Usually, there are two main camps of traders, those that use various indicators and those that trade pure price action. And, of course, some traders use a mix of both.
The most popular indicators are the moving averages, MACD, RSI, Ichimoku Cloud or stochastic. They are usually based on different types of moving averages and give traders signals based on previous behaviour. For example, the RSI indicator shows overbought and oversold conditions in the chart.
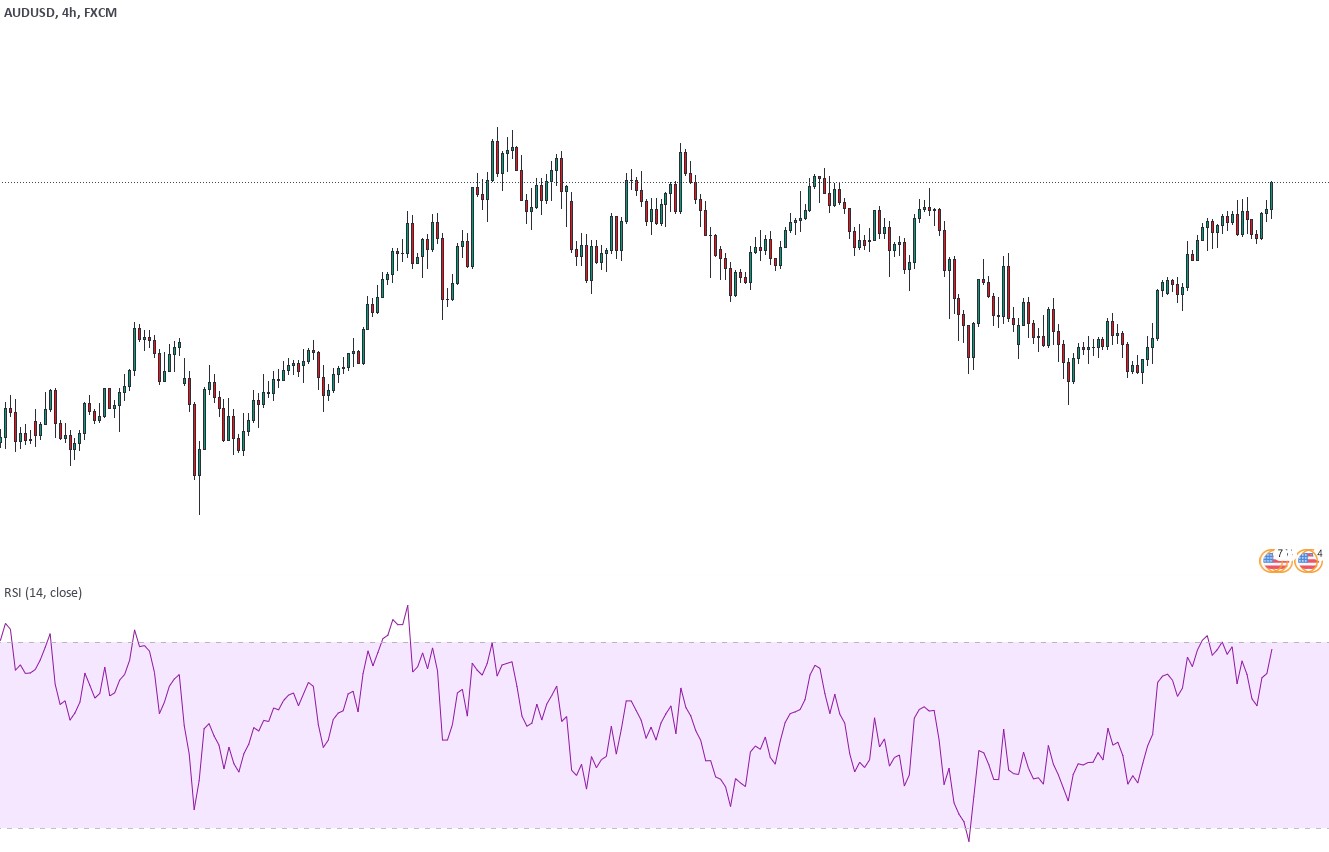
It looks back at price development and determines if an asset is too expensive or cheap. On the other hand, price action traders use different candlestick formations or levels of support and resistance, which they draw on the charts themselves instead of looking at any indicator. They also use different patterns such as head and shoulders, cup and handle, triangles or flags to determine future price movements. The main pros of using technical analysis are that it’s often easier than fundamental analysis, as everything we need is right on the chart. It is relatively easy, gives all information to all traders and gives precise entry, Stop Loss and exit points based on various technical things. The cons of technical analysis are that markets rarely behave in a textbook manner. Due to many different factors that happen in the market, technical levels are often not that accurate, which causes traders to get often stopped out before the anticipated move. Besides that, many technical indicators lag behind the price, so traders often get signals to buy or sell at already established moves.
Fundamental analysis
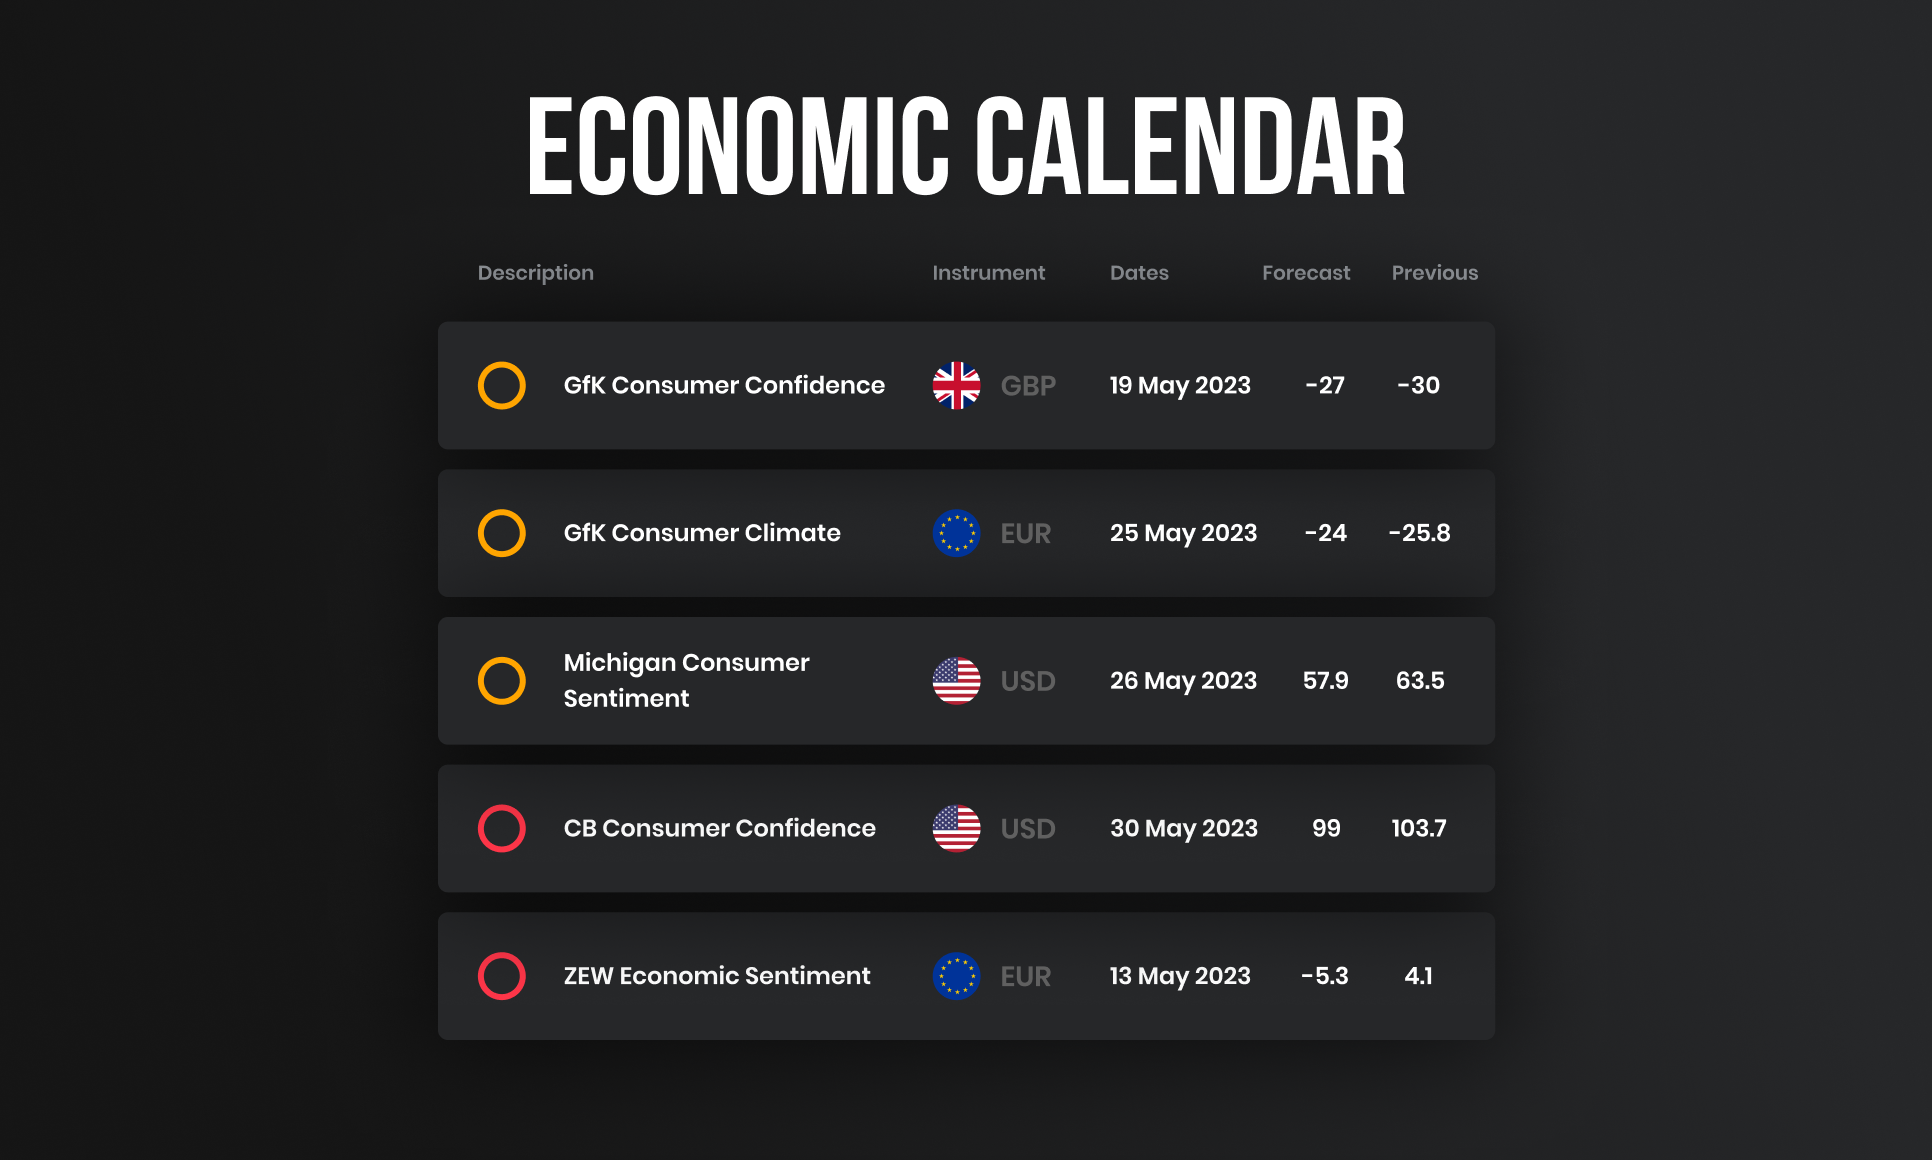
The fundamental analysis determines the value of different instruments based on financial and economic data. In other words, fundamental traders follow different economic, social and political aspects that determine supply and demand. They can, for example, go long on the Japanese yen against the British pound based on the belief that Japan might have a better economic situation compared to Great Britain. Therefore, the Japanese yen should have more value. But with markets, things are not always easy like that. Fundamental analysts must watch inflation, interest rates, government decisions, central banks’ decisions, and macroeconomic events that come out almost daily. Their best friend is a macroeconomic calendar that informs them about upcoming events where data releases are perfectly planned.
One of the main pros of fundamental analysis is that it can be less subjective than technical analysis. It determines the value of a given instrument and can predict price movements before they happen compared to technical indicators that lag behind the price. On the other hand, the fundamental analysis gives traders just ideas but does not signal where to enter and exit trades. There are too many factors that can affect fundamental analysis, and retail traders are usually the last to access critical economic releases.
Sentimental analysis
The sentimental analysis looks at the behaviour of different participants in the financial markets. It examines if there are more buyers or sellers in the market. The Commitments of Traders (COT) reports are the main indicator of sentimental analysis. Commitments of Traders (COT) reports are published weekly by the Commodity Futures Trading Commission (CFTC). The reports show open positions by all the subjects that must report their positions at CFTC. These are positions of big institutional subjects. These big players report their positions every Tuesday evening, and the report is published every Friday at 3:30 PM Eastern time. The COT reports show approximately 70 – 90% of open positions at futures markets.
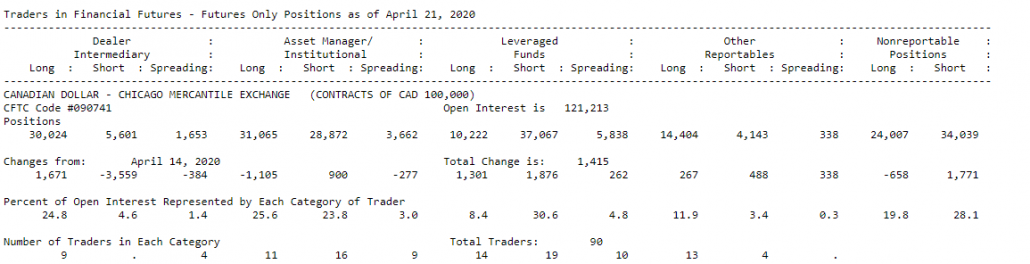
These reports aim to provide transparency to the futures market and prevent price manipulation. Although these reports are from the futures market, we can use this information in spot currencies and CFD trading since spot forex pairs go hand to hand with currency futures, and the futures commodities, metals and indices are the same as their CFD counterparts. The pros of sentimental analysis are that it gives us a very clear idea of what is going on in the market. We can find out what large and small participants are doing in minutes. But there is no definitive answer there. Sometimes large players can be wrong, and the retail crowd can be right. Also, when we see a large institution positioning in some instrument, it can mean that they just started accumulating a big position, so it can take weeks or months before an anticipated move happens.
Statistical analysis
Statistical analysis works very closely with technical analysis, but instead of watching different tools and indicators, traders use statistics of previous market behaviour to develop strategies that require very low human interaction. For example, our FTMO Statistical application shows traders meaningful, historical data-based probabilities of market behaviour that they can use to their advantage. Statistical analysis is very useful as it can remove many emotions from trading. On the other hand, backtesting different strategies requires significant time and dedication. Besides that, market conditions are constantly changing, so if we backtested specific price behaviour that was occurring for the last five years, there is no certainty that it will continue to happen in the future.
So what type of analysis is best to use?
All of them. We know that it sounds like a lot to digest, but if we want to be professional traders, we should be able to utilize all the different aspects of trading. All professionals do is watch key technical levels while being aware of upcoming macroeconomic events, the positioning of large players, and statistical probabilities of things happening in the past.
