


VWAP: Technical Indicator
Want a trading edge used by professionals to spot precise entry and exit points? Discover how the Volume Weighted Average Price (VWAP) can boost your accuracy, highlight market trends, and transform your trading strategy.
What is VWAP (Volume Weighted Average Price)?
Volume Weighted Average Price is an indicator based on volume weighted average price. Represented visually by lines on a chart. VWAP provides traders insights into market trends and potential reversals by integrating both price action and trading volume, which are two critical factors for informed trading decisions.
How is VWAP Calculated?
VWAP is calculated as the sum of the price of each trade in a given time interval multiplied by the volume of trades, and then this sum is divided by the total number of trades for that time. In simple terms, VWAP averages the traded prices by giving more weight to prices with higher trading volumes.
How to Use VWAP
Traders use VWAP to pinpoint market trends, identify precise support and resistance zones, and execute timely trade entries and exits. Here’s how you can apply VWAP effectively to improve your trading strategy:
Identifying Market Trends with VWAP
VWAP indicates bullish market conditions when the price is above the VWAP line and bearish when the price is below. It clearly reveals the dominance of buyers or sellers at any given time.
Determining Support and Resistance Levels using VWAP
The VWAP line and its standard deviations frequently act as robust support and resistance zones, prompting traders to anticipate market reactions at these levels.
Applying VWAP for Entry and Exit Decisions
- Long Trades: Consider entering a long position when the price moves above the VWAP line and retraces back towards it.
- Short Trades: A short position entry is ideal when the price falls below the VWAP line and retraces upward towards it.
VWAP Trading Strategy
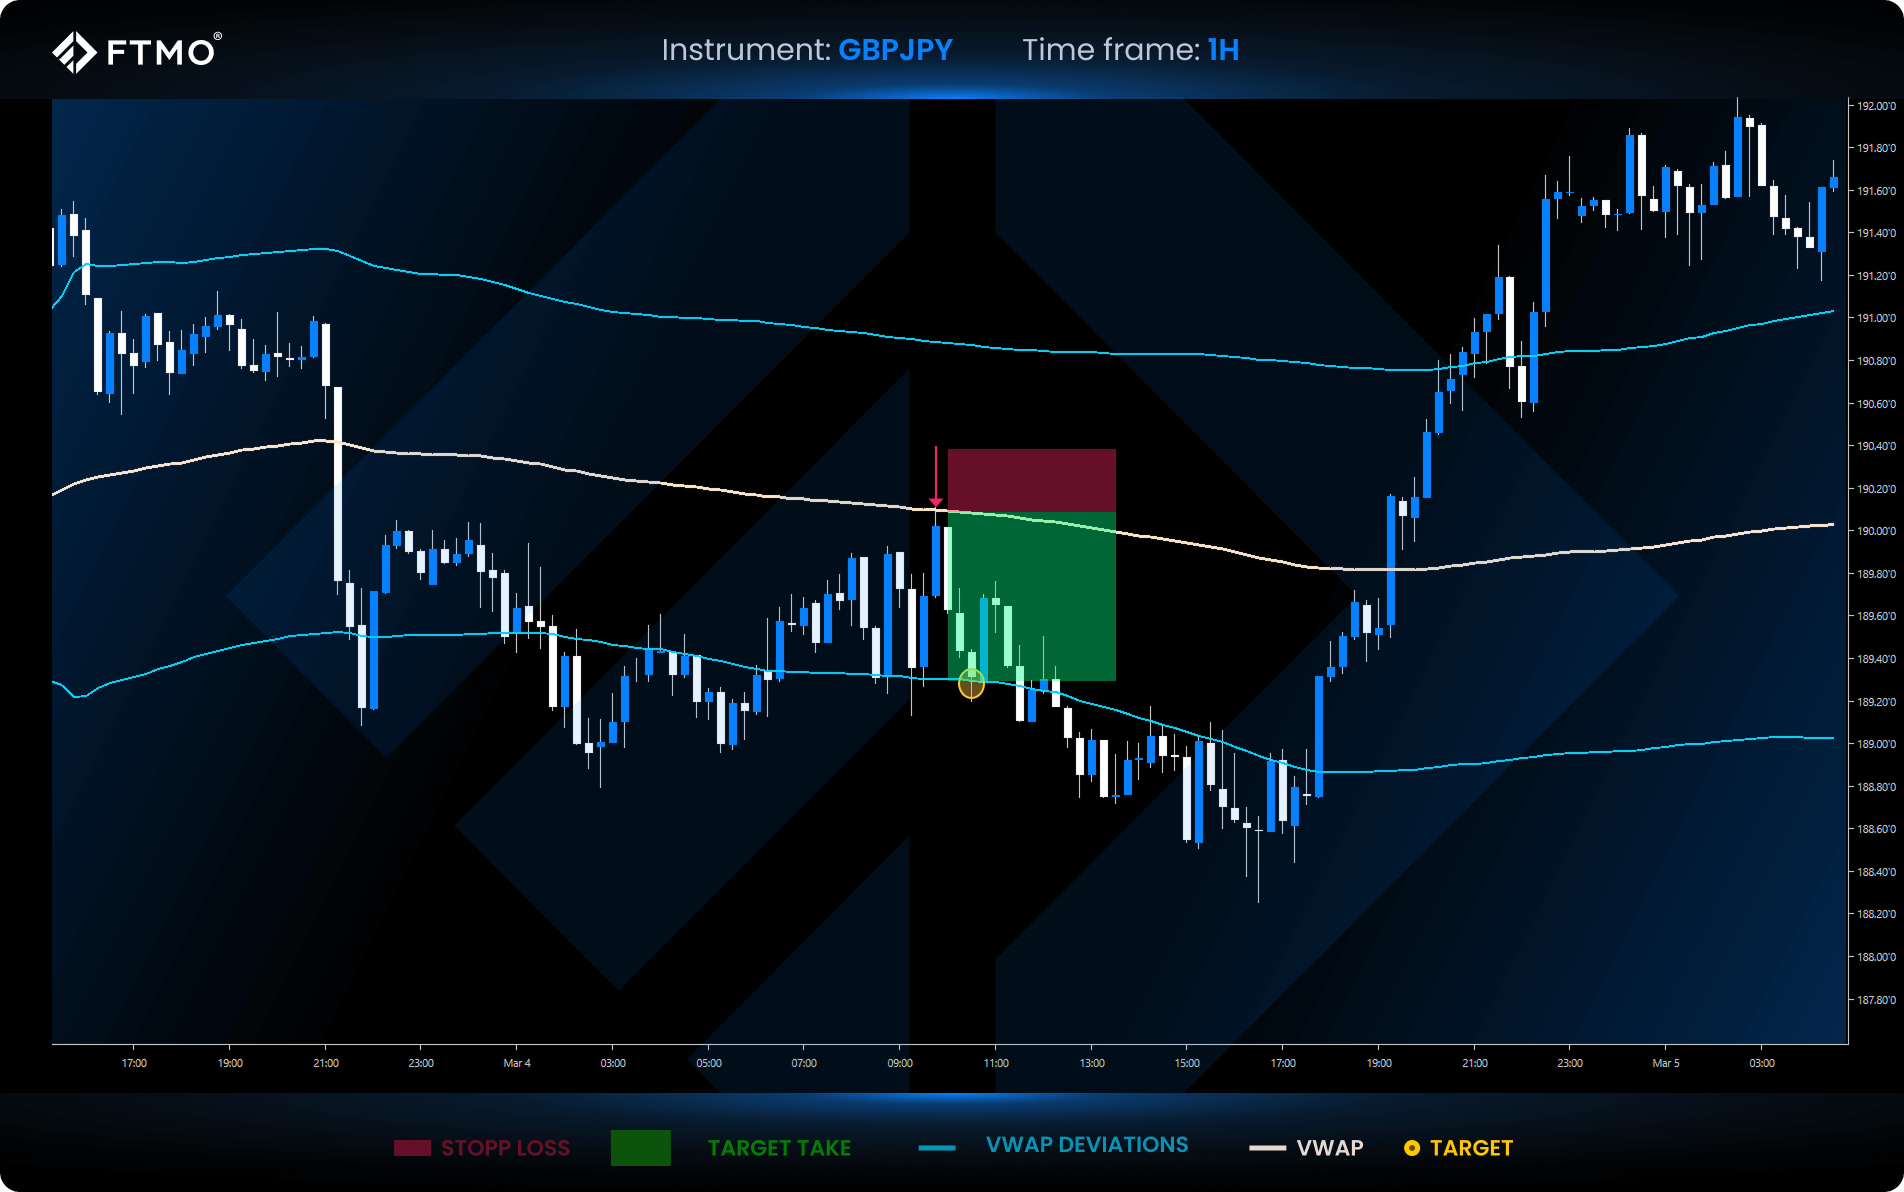
The pullback VWAP strategy is a simple strategy based on the technical analysis of identifying the trend according to the VWAP and returning to the VWAP level.
Entry Rules Example
- Long entry: Wait for the price to rise above the VWAP, then enter upon a pullback to the VWAP line.
- Short Entry: Enter a short position when prices fall below VWAP, again upon a pullback to the VWAP line.
Stop loss and Targets Example
- Stop Loss: Set your stop loss just above (for short trades) or below (for long trades) the VWAP line.
- Profit Target: Aim for the next VWAP deviation or use a trailing stop for larger trades.
Choosing the Right Indicator: VWAP vs. SMA
VWAP offers precise, short-term insights by blending price and volume of trades – perfect for day traders. SMA uses only data from price, which makes it simpler but better suited for swing trading over hours or days.
Need precision and volume analysis? Go with VWAP. Prefer simplicity for longer trades? Stick with SMA.
Advantages and Disadvantages of VWAP
Like any trading indicator, VWAP has its strengths and weaknesses. Knowing these can help you avoid costly mistakes and make smarter trading decisions. Here are the most critical advantages and disadvantages to keep in mind:
Advantages
- Volume integration: Provides more accurate trading signals due to the inclusion of volume.
- Clear support/resistance levels: Precisely identifies critical market levels.
- Quick trend identification: Clearly indicates current market trends.
Disadvantages
- Early trading session limitations: Less accurate at market open due to limited data.
- Lagging indicator: VWAP may not react immediately to market changes because it is based on historical data.
- Limited effectiveness on strong trend days: Opportunities might be fewer on highly trending days.
Enhancing VWAP with Additional Indicators
Combining VWAP with other technical indicators can significantly enhance its effectiveness in providing valuable insights for trading decisions.
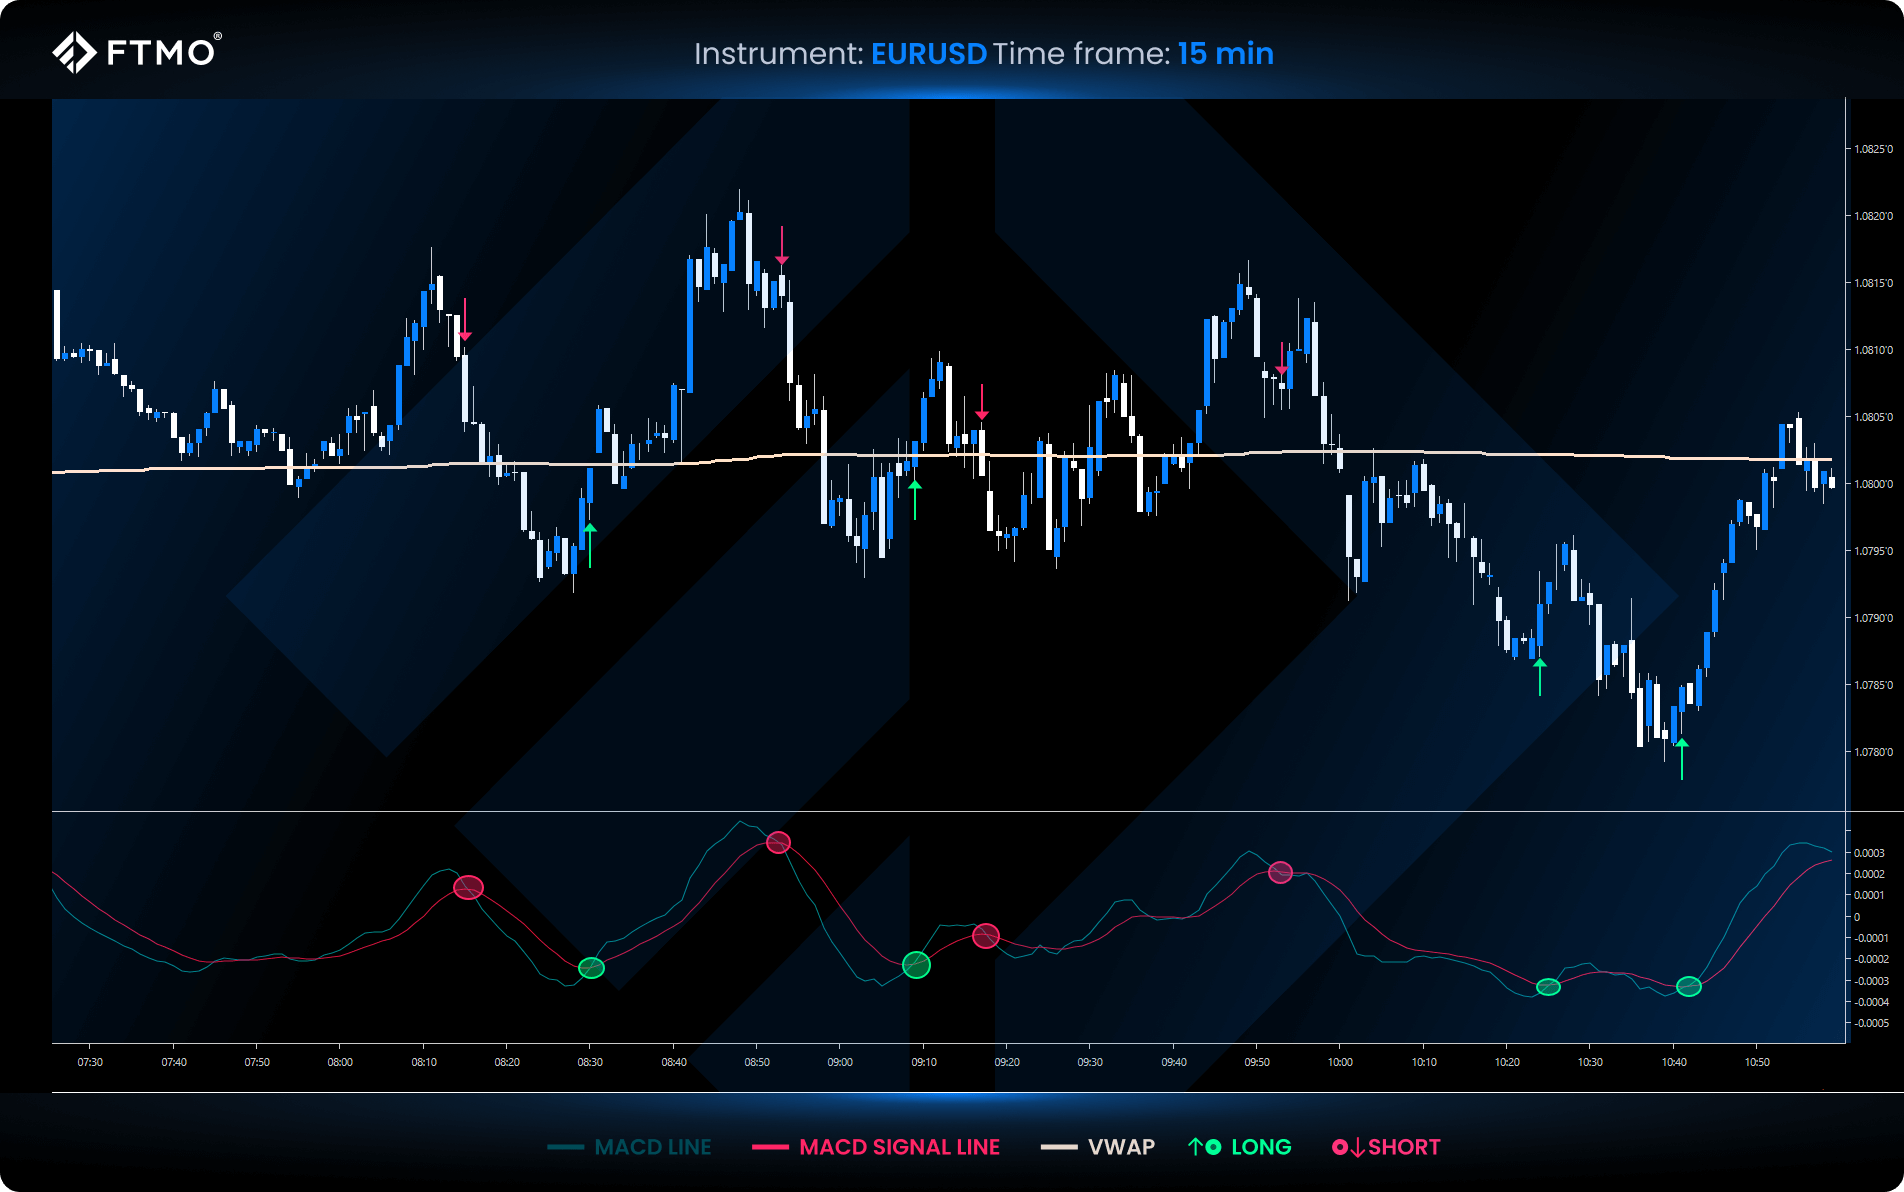
VWAP and MACD
Use MACD as a trend-following indicator that identifies market trends and potential reversals to confirm VWAP signals:
- Bullish when price is above VWAP and MACD shows a bullish crossover.
- Bearish when price is below VWAP with a bearish MACD crossover.
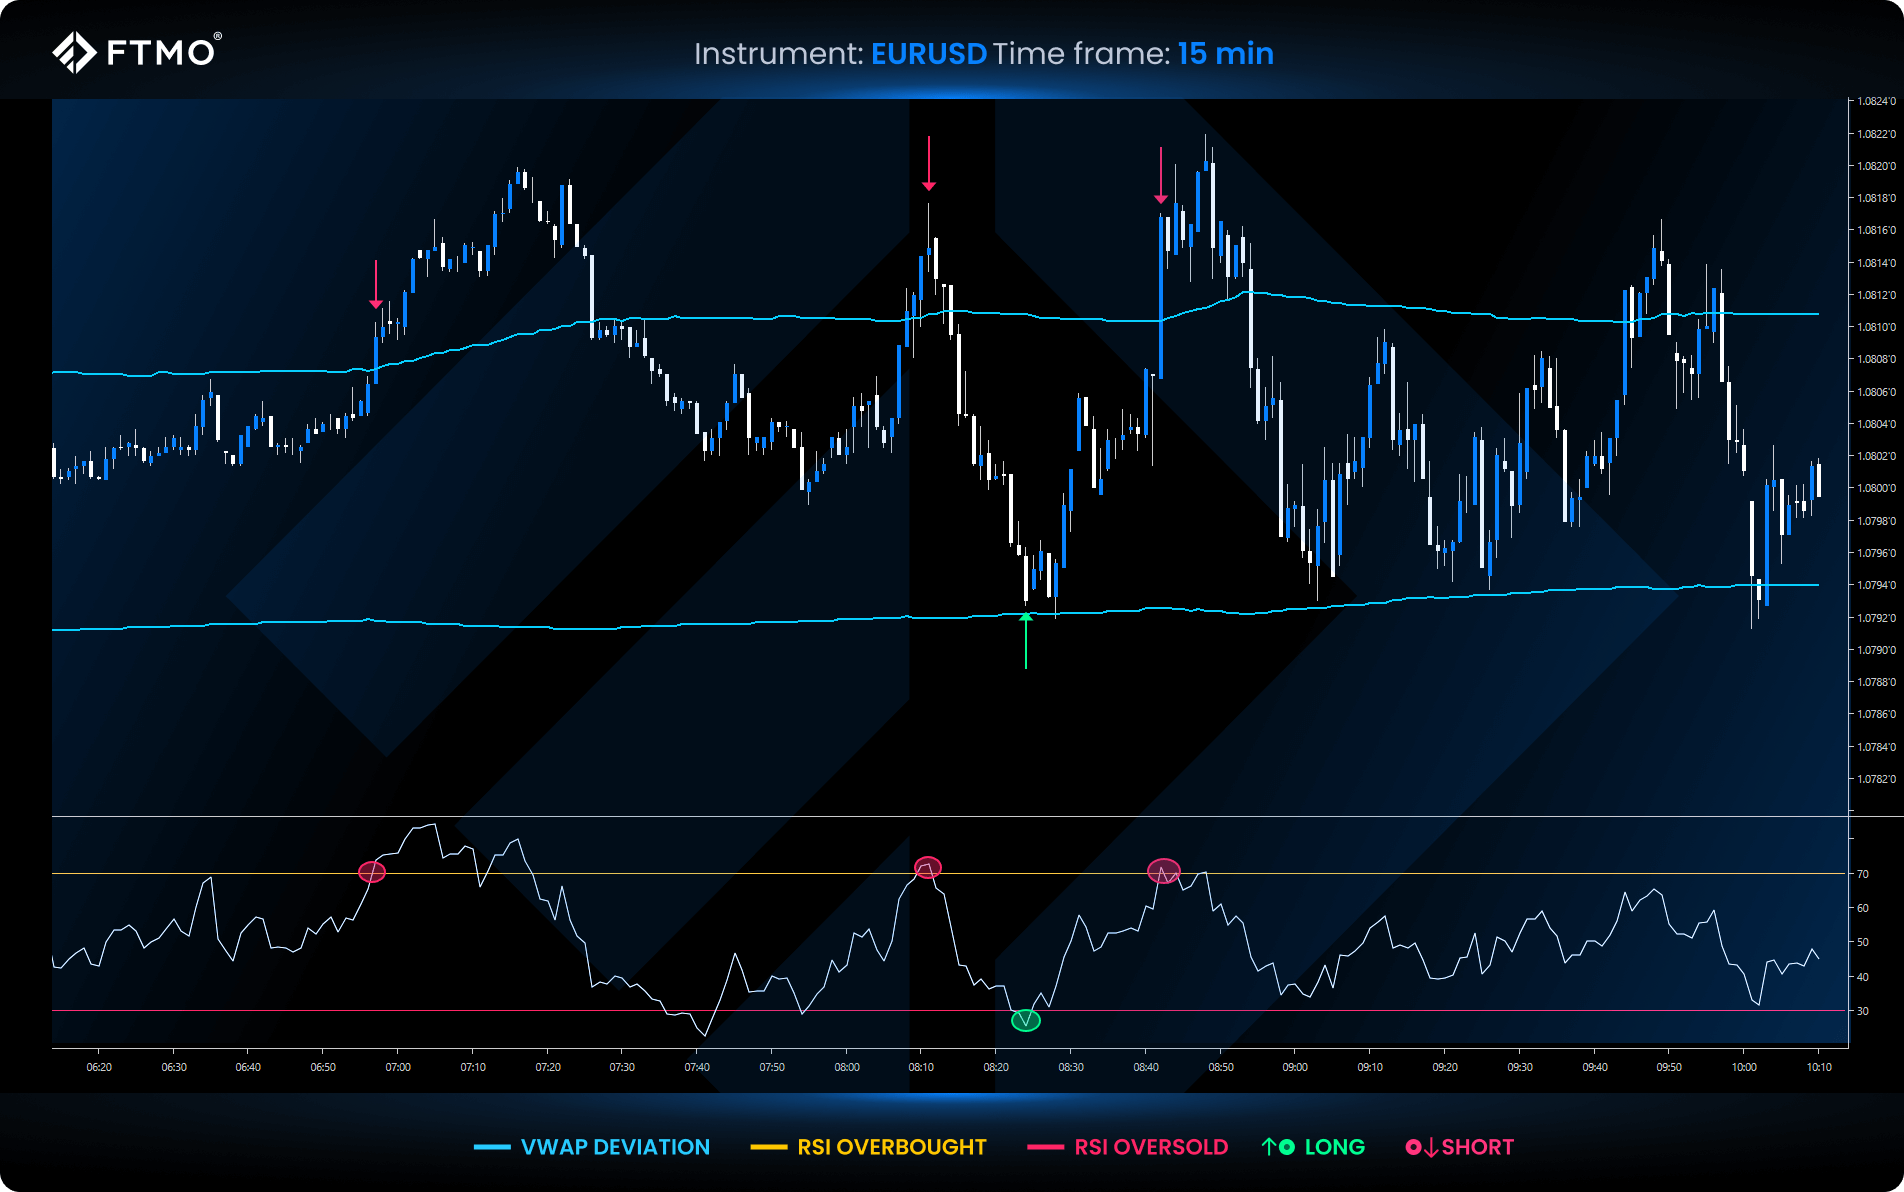
VWAP and RSI
RSI is a momentum oscillator that measures the speed and magnitude of price movements on a scale of 0 to 100 and complements VWAP by highlighting overbought (above 70) or oversold (below 30) market conditions:
- An overbought RSI near VWAP resistance could suggest a possible downturn.
- Oversold RSI near VWAP support might indicate a potential upward move.
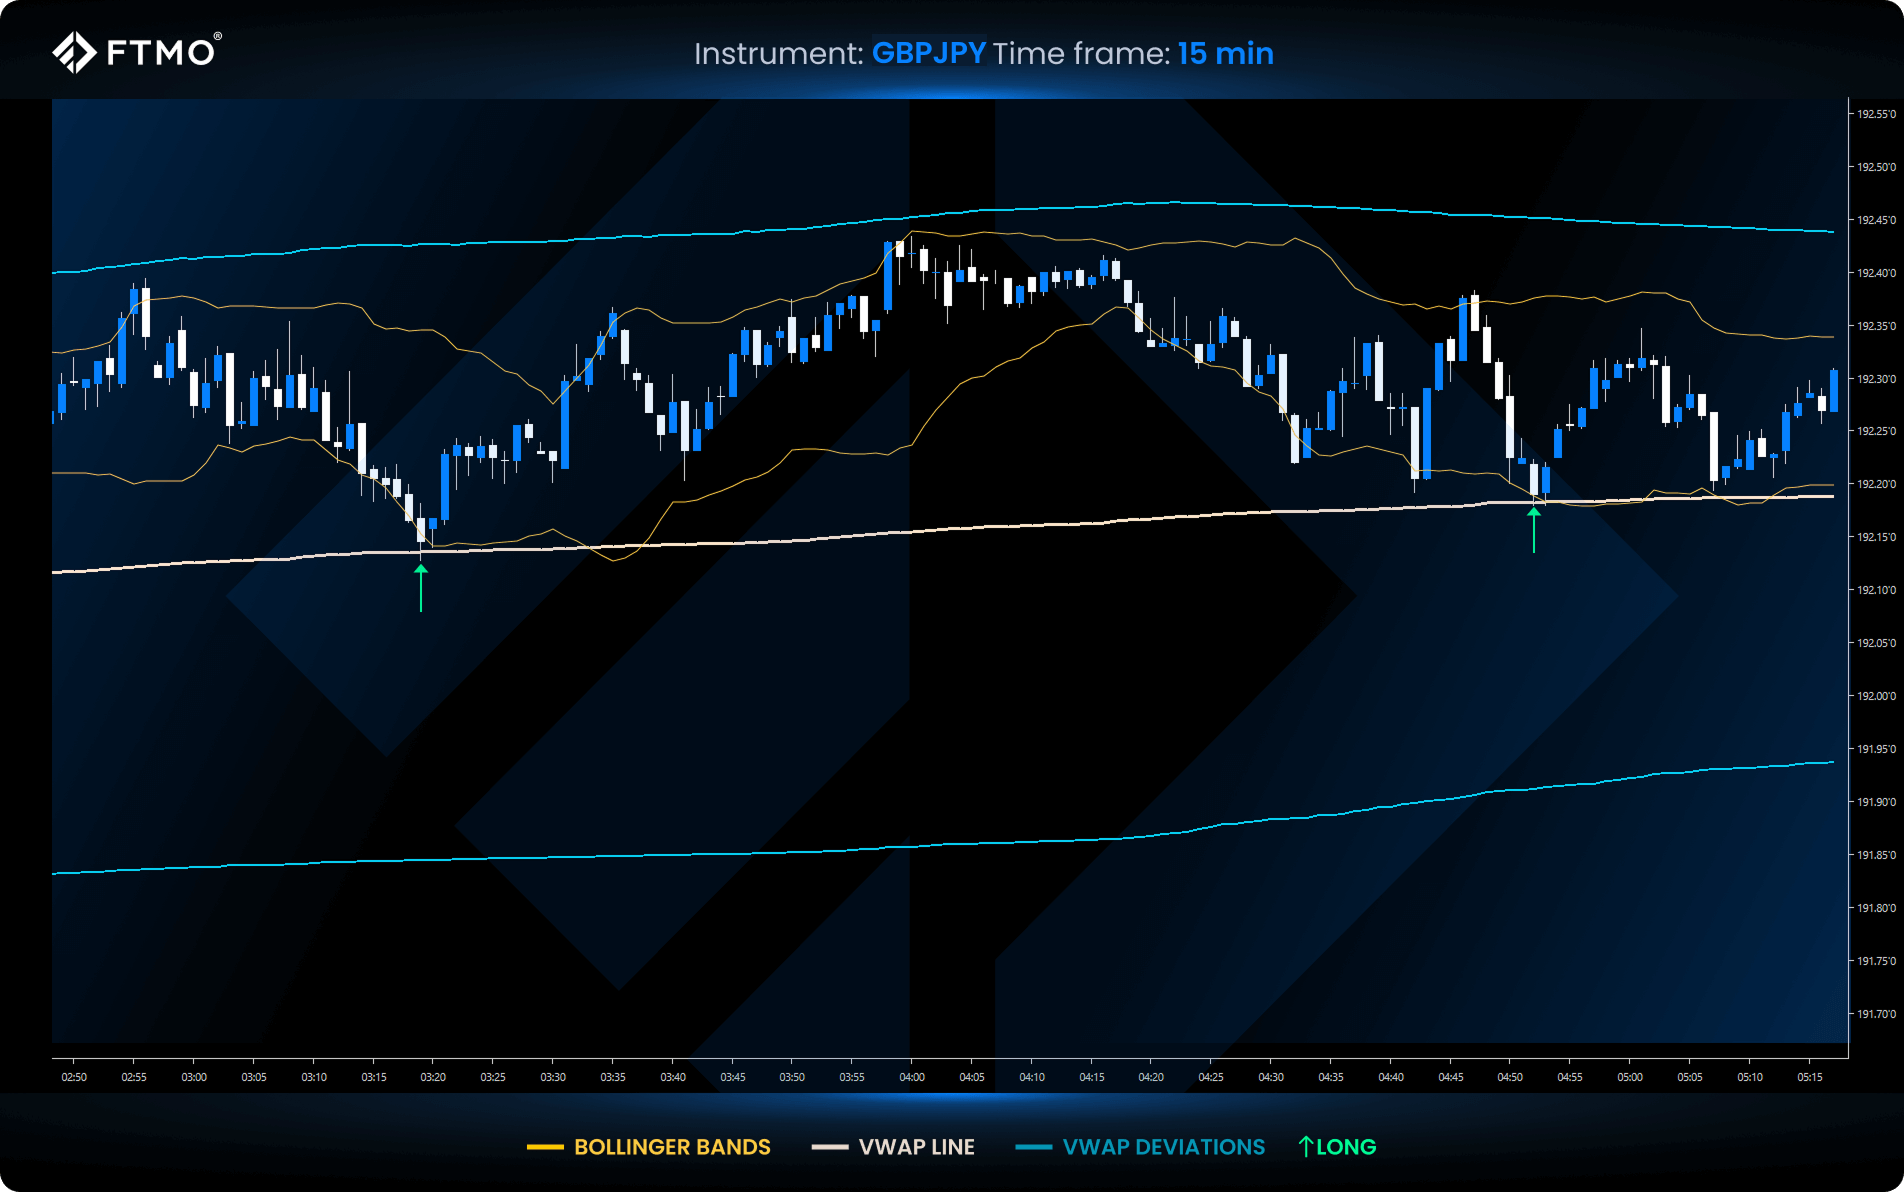
VWAP and Bollinger Bands
Bollinger Bands are based on the same principle as RSI and help VWAP by pinpointing extreme price deviations:
- Initiate short trades when the price reaches both the upper Bollinger Band and VWAP deviation.
- Initiate long trades when the price reaches the lower Bollinger Band and VWAP deviation.
Key Takeaways
- VWAP (Volume Weighted Average Price) combines price and volume, helping traders identify market trends and reversals accurately.
- Price above VWAP indicates bullish market sentiment; price below VWAP signals bearish sentiment, offering clear entry and exit points.
- VWAP deviations act as strong support and resistance levels.
