


Bollinger Bands: Technical Indicator
Find out how Bollinger Bands can enhance your trading strategy. Learn to spot trends, identify breakouts, and trade forex, stocks or crypto with confidence!
What Are Bollinger Bands?
Bollinger Bands are a popular tool in technical analysis, primarily due to their applicability across nearly all markets. They were named after their creator, John Bollinger, who developed this indicator in the 1980s. On a chart, they appear as three lines forming an envelope within which the price fluctuates.
Bollinger Bands description
- Upper band: 20-day Simple Moving Average (SMA 20) + 2 times the standard deviation
- Middle line: 20-day Simple Moving Average (SMA 20)
- Lower band: 20-day Simple Moving Average (SMA 20) – 2 times the standard deviation
The standard deviation values can be adjusted depending on the trading style and asset. For instance, when using a 50-period moving average, a multiplier of at least 2.1 is recommended, whereas for shorter periods, this factor may be lower than 2.
How Do Bollinger Bands Work?
Bollinger Bands measure market volatility, helping traders determine whether the market is in an accumulation phase or trending. This, in turn, provides signals for potential trend beginnings. These signals can be observed through the expansion and contraction of the bands, which adapt to market conditions based on volatility.
Usage of Bollinger Bands
- Identifying overbought and oversold areas: This approach is popular among investors who use Bollinger Bands to assess whether an asset is undervalued or overvalued.
- Determining trend reversals: Bollinger Bands can help identify trend reversals. For instance, in a strong downtrend, if the price moves above the lower Bollinger Band, this may indicate a weakening trend and a potential reversal.
- Using deviations as support and resistance levels: the lower deviation is a support level, and the upper deviation is a resistance level.
- Measuring market volatility: The contraction and expansion of Bollinger Bands indicate volatility. When the bands are close together, it signals low volatility, whereas when they widen apart, it indicates high volatility.
Bollinger Bands Trading Strategies for Forex, Stocks or Crypto
Bollinger Bands provide versatile and effective trading strategies applicable to Forex, stocks or crypto markets. Two of the most popular strategies are the breakout strategy and the reversal strategy, which enable traders to capitalize on volatility shifts and identify precise entry and exit points for improved trading performance
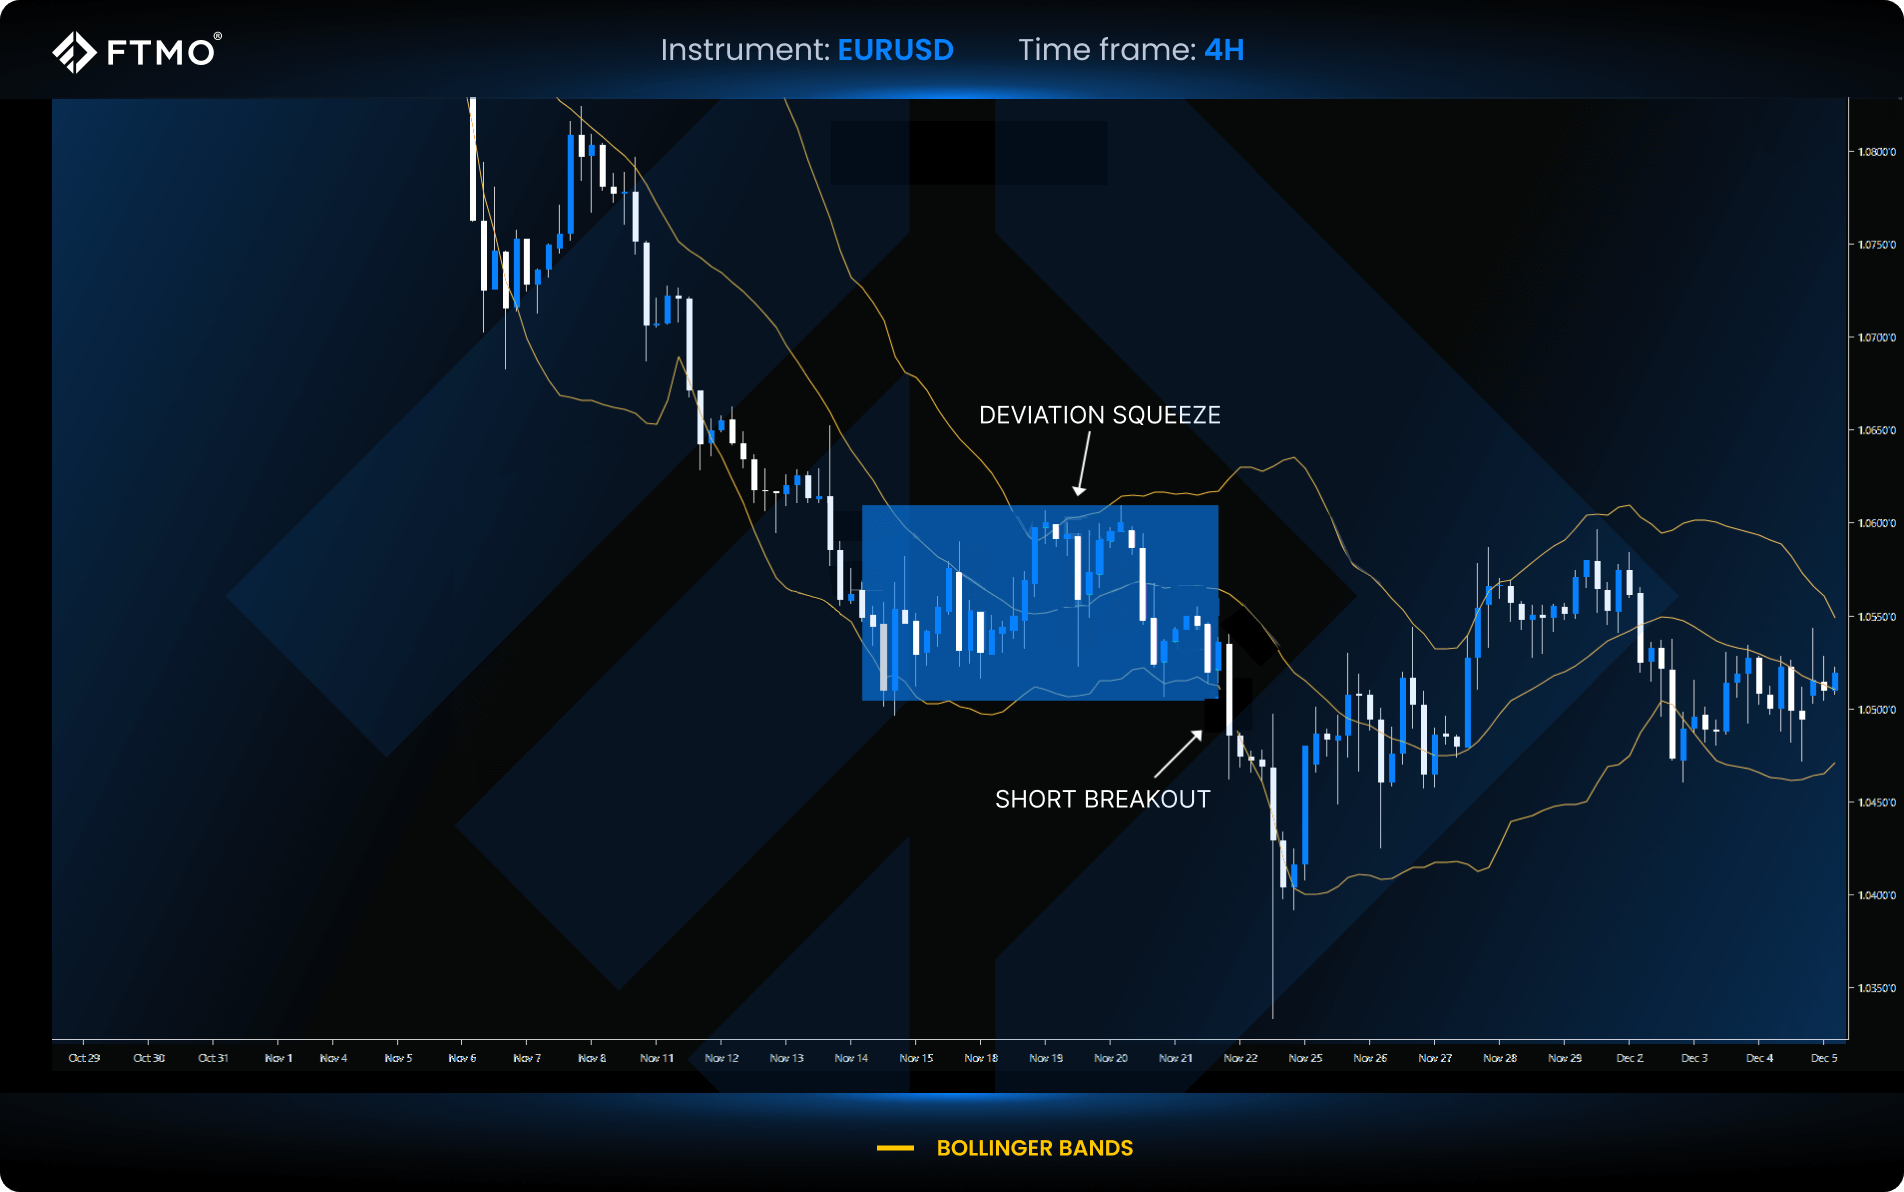
Bollinger Bands Breakout Strategy (squeeze)
This strategy is based on the contraction and expansion of Bollinger Bands, followed by a breakout of one of them. A Bollinger Bands squeeze signals an accumulation zone and the preparation for a trend.
Strategy conditions:
1. Both Bollinger Bands must be squeezed.
2. A subsequent breakout of one of the bands.
3. If the lower band is broken, it is a signal for a short position.
4. Conversely, if the upper band is broken, it indicates a long position.
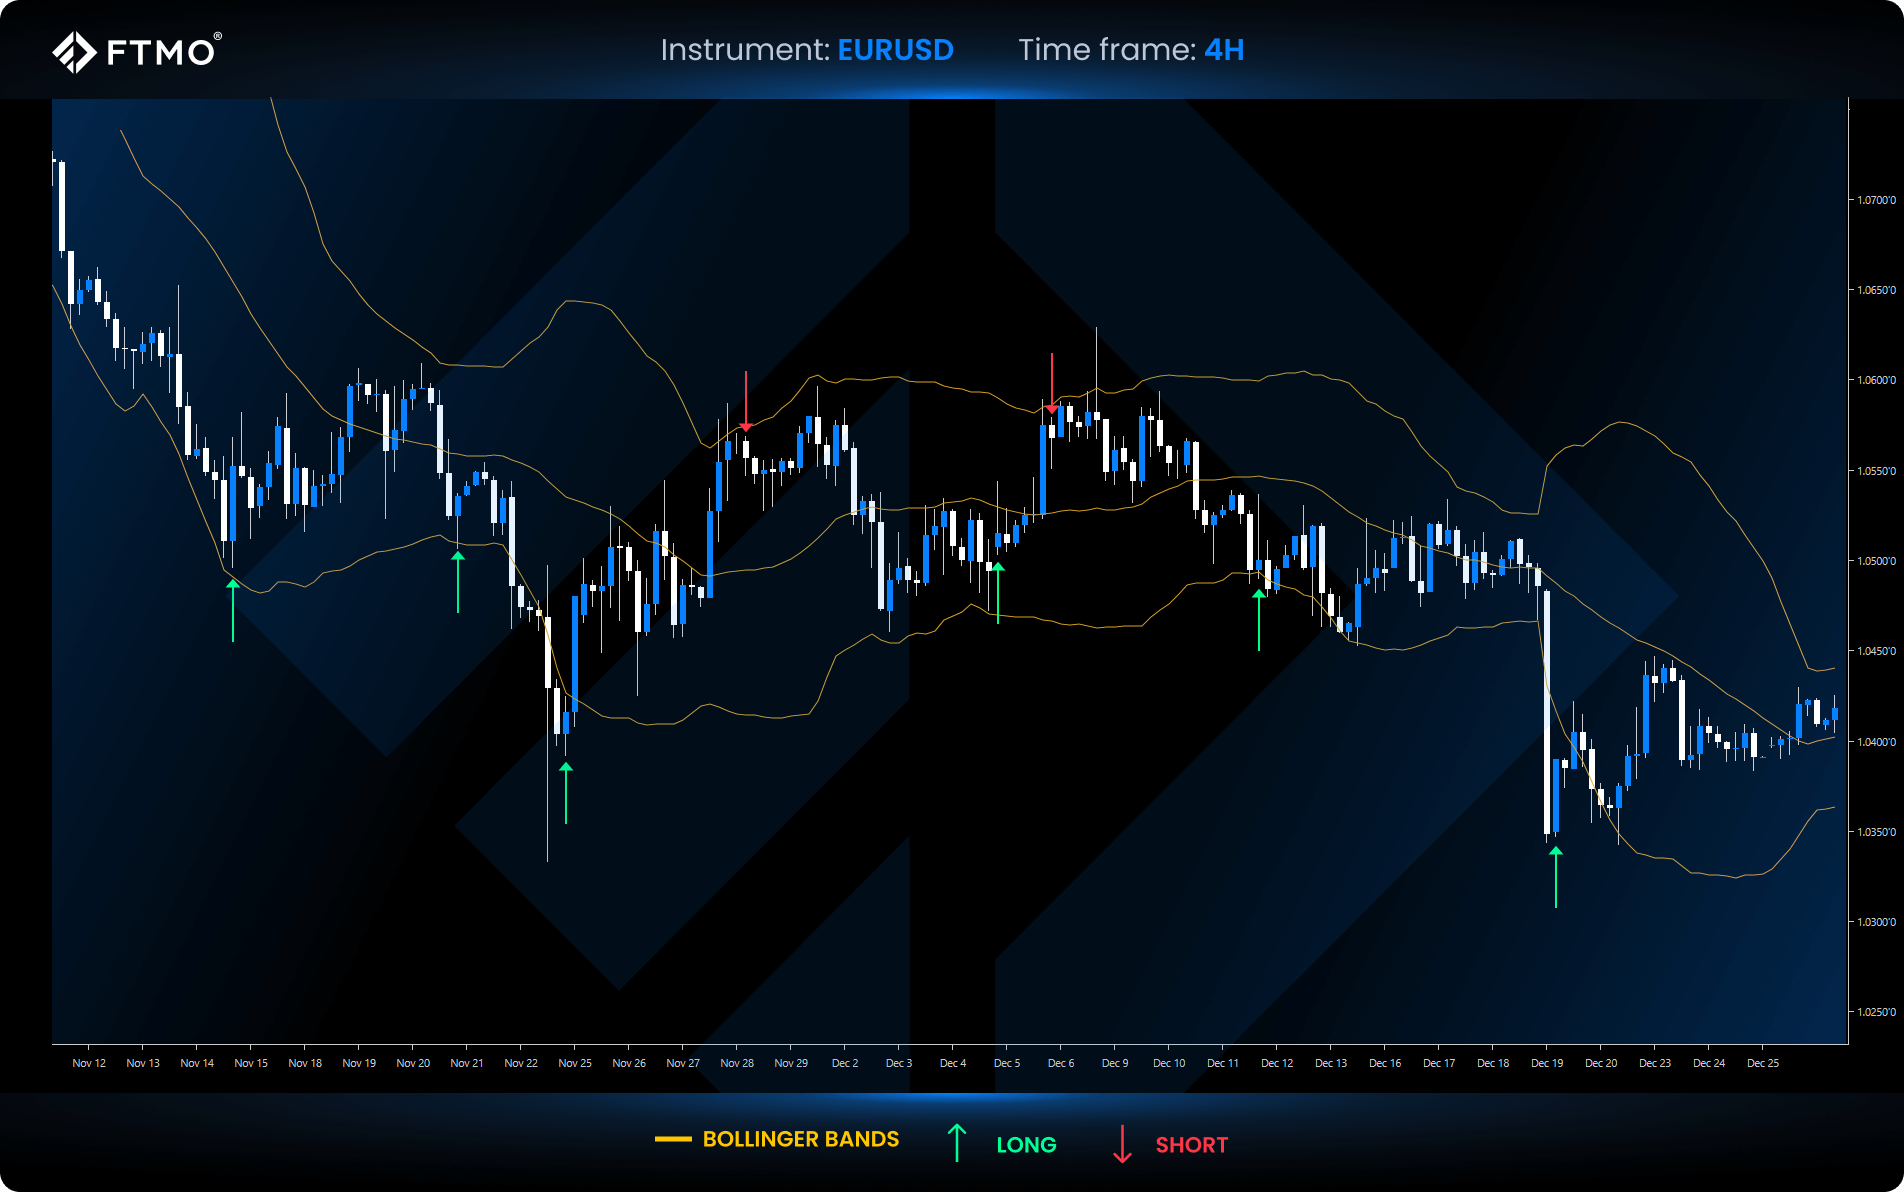
Bollinger Bands Reversal Strategy (support and resistance)
This strategy utilises the upper and lower Bollinger Bands as support and resistance levels to trade trend reversals. To improve confirmation and reduce false signals, traders may use price action for additional validation.
Strategy conditions:
1. A touch of the upper or lower Bollinger Band
2. For a short position, wait for confirmation with a bearish candlestick after touching the upper band.
3. For a long position, wait for the lower band to be touched, followed by the formation of a bullish candlestick.
Key Takeaways
- Bollinger Bands measure market volatility and consist of three lines: an upper band, a lower band, and a middle (20-day SMA) line.
- Bands expand and contract to indicate high or low volatility, signalling potential market breakouts or reversals.
- To increase signal accuracy, it is advisable to confirm Bollinger Band signals with other indicators such as VWAP, RSI, ATR, or price action.
- Touching Bollinger Bands isn’t an automatic buy or sell signal; price can stay beyond bands, especially during strong trends.
