


Keltner Channels: Technical Indicator
Learn how the Keltner Channel helps traders spot trends, breakouts, and reversals using EMA and ATR for smarter trading decisions.
What are the Keltner Channels?
The Keltner Channels is a technical analysis indicator that uses the Exponential Moving Average (EMA) and the Average True Range (ATR) to create dynamic price bands. Originally introduced by Chester W. Keltner, it first used a Simple Moving Average (SMA) and price range calculations before being refined with EMA and ATR for improved adaptability. The trading strategies of Linda Raschke helped to popularise the Keltner Channels.
Understanding the Keltner Channels Indicator
They are effective for identifying breakouts and extreme price movements in volatile assets. Keltner channels consist of three lines:
- Upper band = EMA + 2x ATR
- Middle line = EMA (typically 20)
- Lower band = EMA – 2x ATR
The upper and lower bands are typically set at twice the ATR above and below the 20-period EMA. Unlike Bollinger Bands, which react to price volatility using standard deviation, the Keltner Channels signal buy opportunities at the upper band and sell opportunities at the lower band.
How to Use Keltner Channels in Trading
1. Trend Identification
When price consistently moves above the middle line or, in a strong move, the upper band, it signals an uptrend. Conversely, if the price stays below the middle line or lower band, it indicates a downtrend.
2. Breakout Trading
Breakouts occur when price closes outside the channels, suggesting strong momentum. Traders often enter long positions when the price breaks above the upper band and short positions when it breaks below the lower band.
3. Identifying Overbought & Oversold Conditions
Prices touching or exceeding the upper band suggest overbought conditions, while touching or falling below the lower band signals oversold conditions. Market conditions, such as strong trends or reactions to economic news, can cause extended periods of overbought or oversold conditions. Therefore, these conditions alone do not necessarily indicate a market reversal.
4. Reversal Trading
Traders may look for potential reversals when the price consistently reaches extreme levels near the bands and then returns toward the middle line.
Keltner Channels vs. Bollinger Bands
Both Keltner Channels and Bollinger Bands are valuable tools for analysing market conditions, but they serve different purposes:
Keltner Channels are generally smoother and better suited for identifying trends and breakouts, whereas Bollinger Bands react more sharply to price movements, making them more useful in reversion strategies.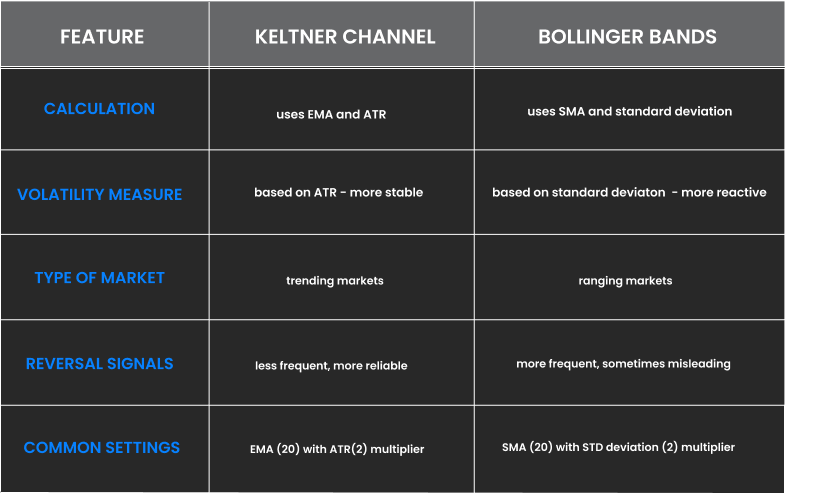
Keltner Channel Strategy for Trading
This strategy focuses on trading breakouts and retracements within the Keltner Channels. After a price breakout, traders wait for a pullback to the middle EMA line before entering a position. Profits are managed by closing part of the position at a target level while letting the rest follow the trend using a trailing stop-loss.
Entry Rules Example:
1. Wait for the price to break out above the upper band or below the lower band.
2. After the breakout, wait for a retracement back to the middle EMA line.
3. Enter long when the price pulls back to the EMA line after an upper band breakout.
4. Enter short when the price pulls back to the EMA line after a lower band breakout.
Stop-Loss, Target & Trailing Stop Example:
- Stop-loss: The stop-loss for a long position is placed below the lower Keltner band, while the stop-loss for a short position is placed above the upper Keltner band.
- Target take: Split the position into two parts. Close 70% of the position at the opposite Keltner band (upper band for long trades, lower band for short trades). Let the remaining 30% run with the trend, using a trailing stop.
- Trailing stop: Adjust the stop-loss according to swing highs (for short positions) and swing lows (for long positions).
Keltner Strategy Demonstration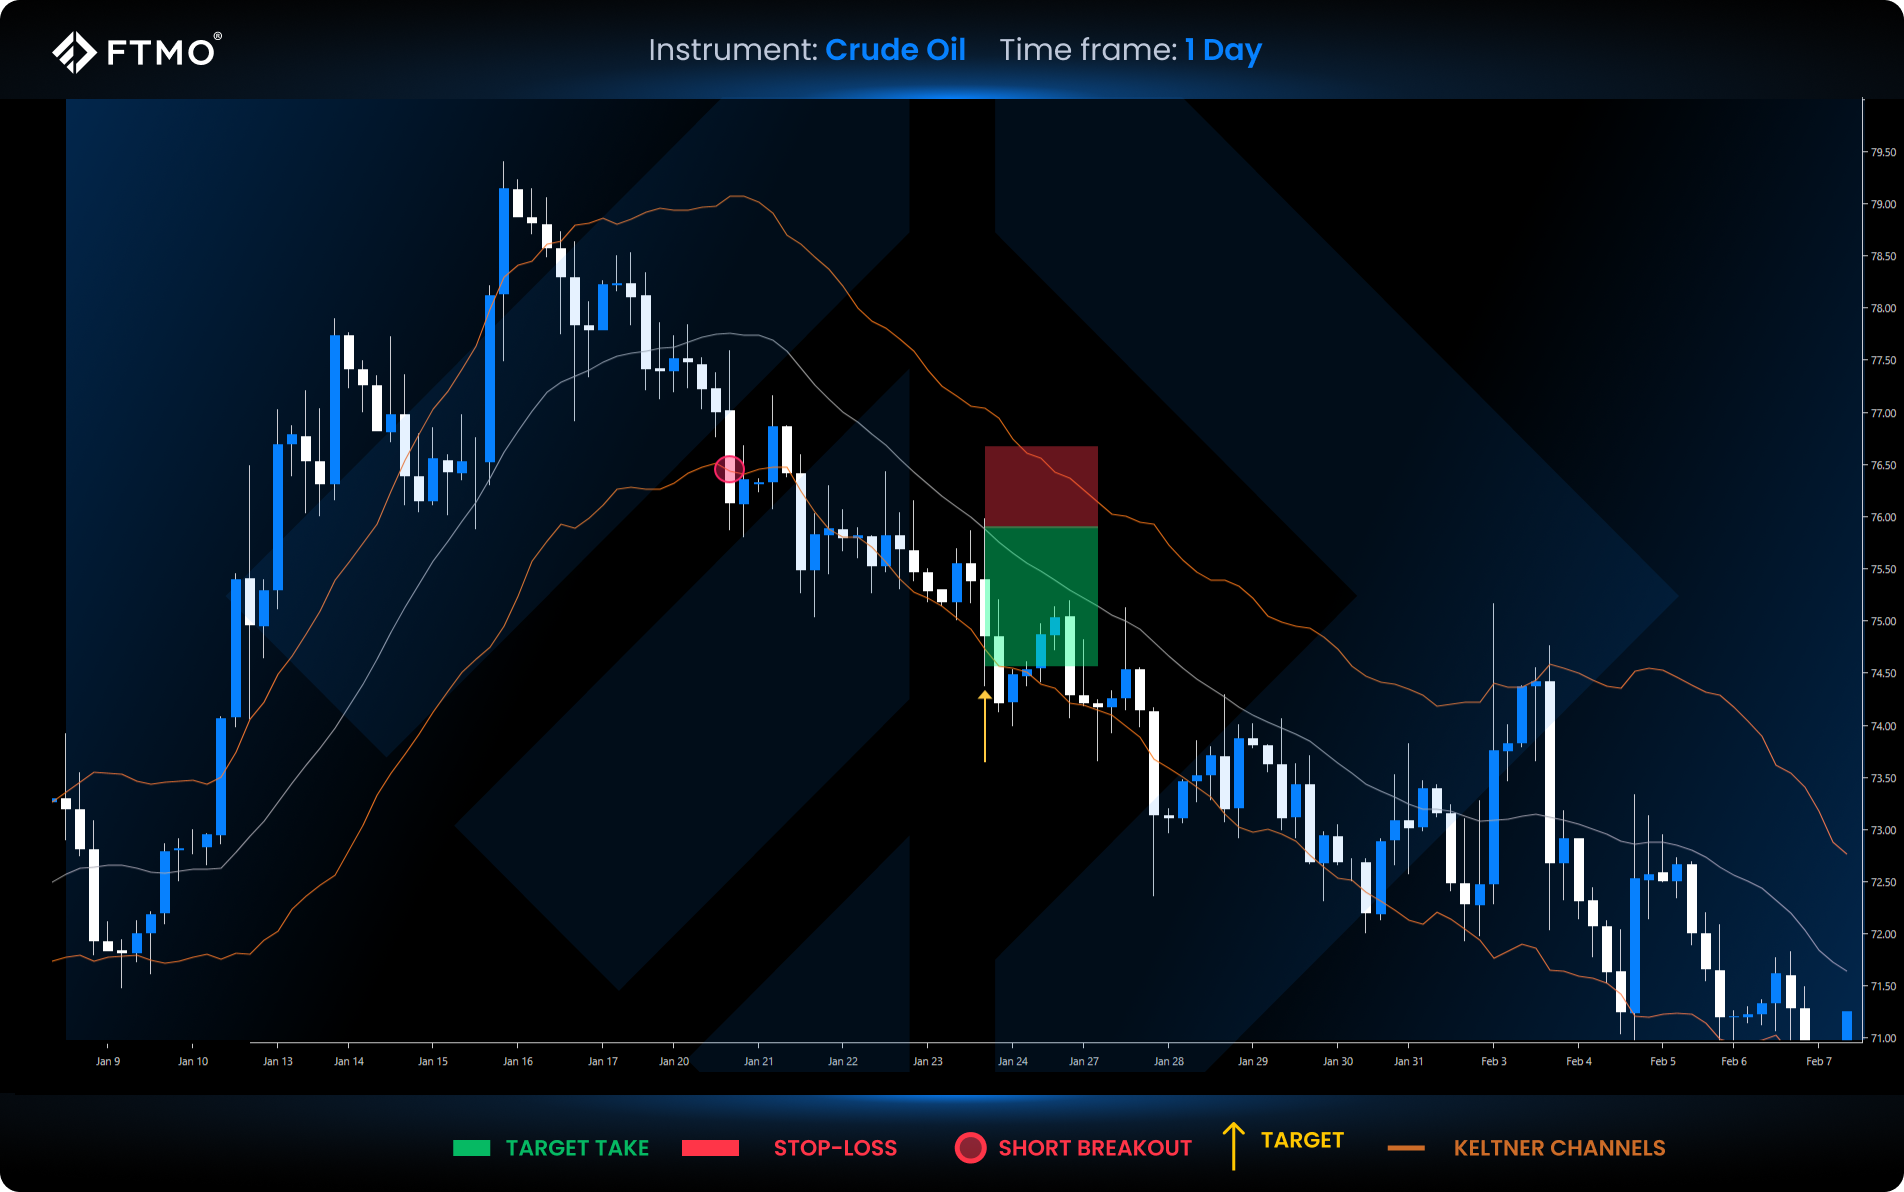
Key takeaways
- Keltner channels overview:
The Keltner Channels is a technical indicator that uses the exponential moving average (EMA) and average true range (ATR) to create price bands that assist traders in recognising trends, breakouts, and reversals. - Keltner channel vs. Bollinger bands:
Keltner Channels use ATR for smoother trend-following, while Bollinger Bands rely on standard deviation. - Combine the Keltner channels with other indicators:
For example, RSI, MACD, or you can use more advanced volume analysis to confirm signals and avoid false breakouts.
