


MACD: Technical Indicator
Learn everything about MACD, a powerful momentum indicator used in trading. Discover how to use MACD crossovers, divergences, and strategies with RSI and Bollinger Bands to spot buy and sell signals.
What is Moving Average Convergence Divergence (MACD)?
MACD is a trend-following momentum indicator that shows the strength and direction of a trend. Developed by Gerald Appel in the late 1970s, it consists of:
- MACD Line: Calculated as the difference between the 26-day and 12-day Exponential Moving Averages (EMAs).
- Signal Line: A 9-day EMA of the MACD line, used to generate trading signals.
- Histogram: Represents the distance between the MACD line and the signal line, providing a visual indication of momentum shifts.
How to Calculate MACD
Understanding how MACD is calculated helps traders better interpret the signals it produces. The MACD calculation consists of three main components:
1. Subtract the 26-day EMA from the 12-day EMA to get the MACD line.
2. The signal line is simply a 9-day EMA of the MACD line.
3. The histogram is derived by subtracting the signal line from the MACD line.
Note: When the MACD line crosses above the signal line, it indicates bullish momentum, whereas crossing below suggests bearish momentum.
How to Use MACD in Trading
Traders use the MACD indicator to understand how strong a trend is, where the price might be headed, and when a reversal could be coming. It works well in different market conditions and on all timeframes. Whether you’re trading for a few minutes, a few days, or holding for longer. Among the many ways to use MACD, three techniques stand out as the most popular:
1. MACD Crossover
A crossover occurs when the MACD line crosses the signal line, generating buy or sell signals.
Bullish crossover (buy signal): Occurs when the MACD line from the bottom crosses the signal line, which creates a buy signal.
Bearish crossover (sell signal): It is when the MACD line crosses the signal line from above and forms a sell signal.
2. MACD Divergence
It is based on the divergent movements of the MACD and the price chart. For example, if the price is rising and MACD is falling, or the other way around.
Bullish divergence (buy signal): Occurs if the price chart creates local lows and the MACD creates new highs.
Bearish divergence (sell signal): It is the opposite of bullish divergence, and therefore, if the MACD is falling and making new lows and the price chart is rising and making new highs. It is an indication of an upcoming fall.
3. Increase and Decrease of MACD
A strong deviation of the MACD line from the signal line may indicate overbought or oversold. To better determine overbought and oversold conditions, we can also add the RSI indicator.
Using MACD with Other Indicators
While MACD is powerful on its own, combining it with other technical indicators can significantly improve accuracy and reduce false signals. Two of the most common combinations are with RSI and Bollinger Bands.
How to Use MACD with RSI?
There are several uses of MACD with RSI, but one of the most used is to monitor the RSI overbought and oversold levels while monitoring the MACD crossover. This use of the two indicators can give us more precision on potential trend changes and reduce the number of false signals compared to using only one of them.
Long signal: RSI in the oversold zone, so below 30, and subsequent crossover of the MACD line with the signal line.
Short signal: If the RSI is above 70, therefore overbought, we wait for the MACD crossover signal.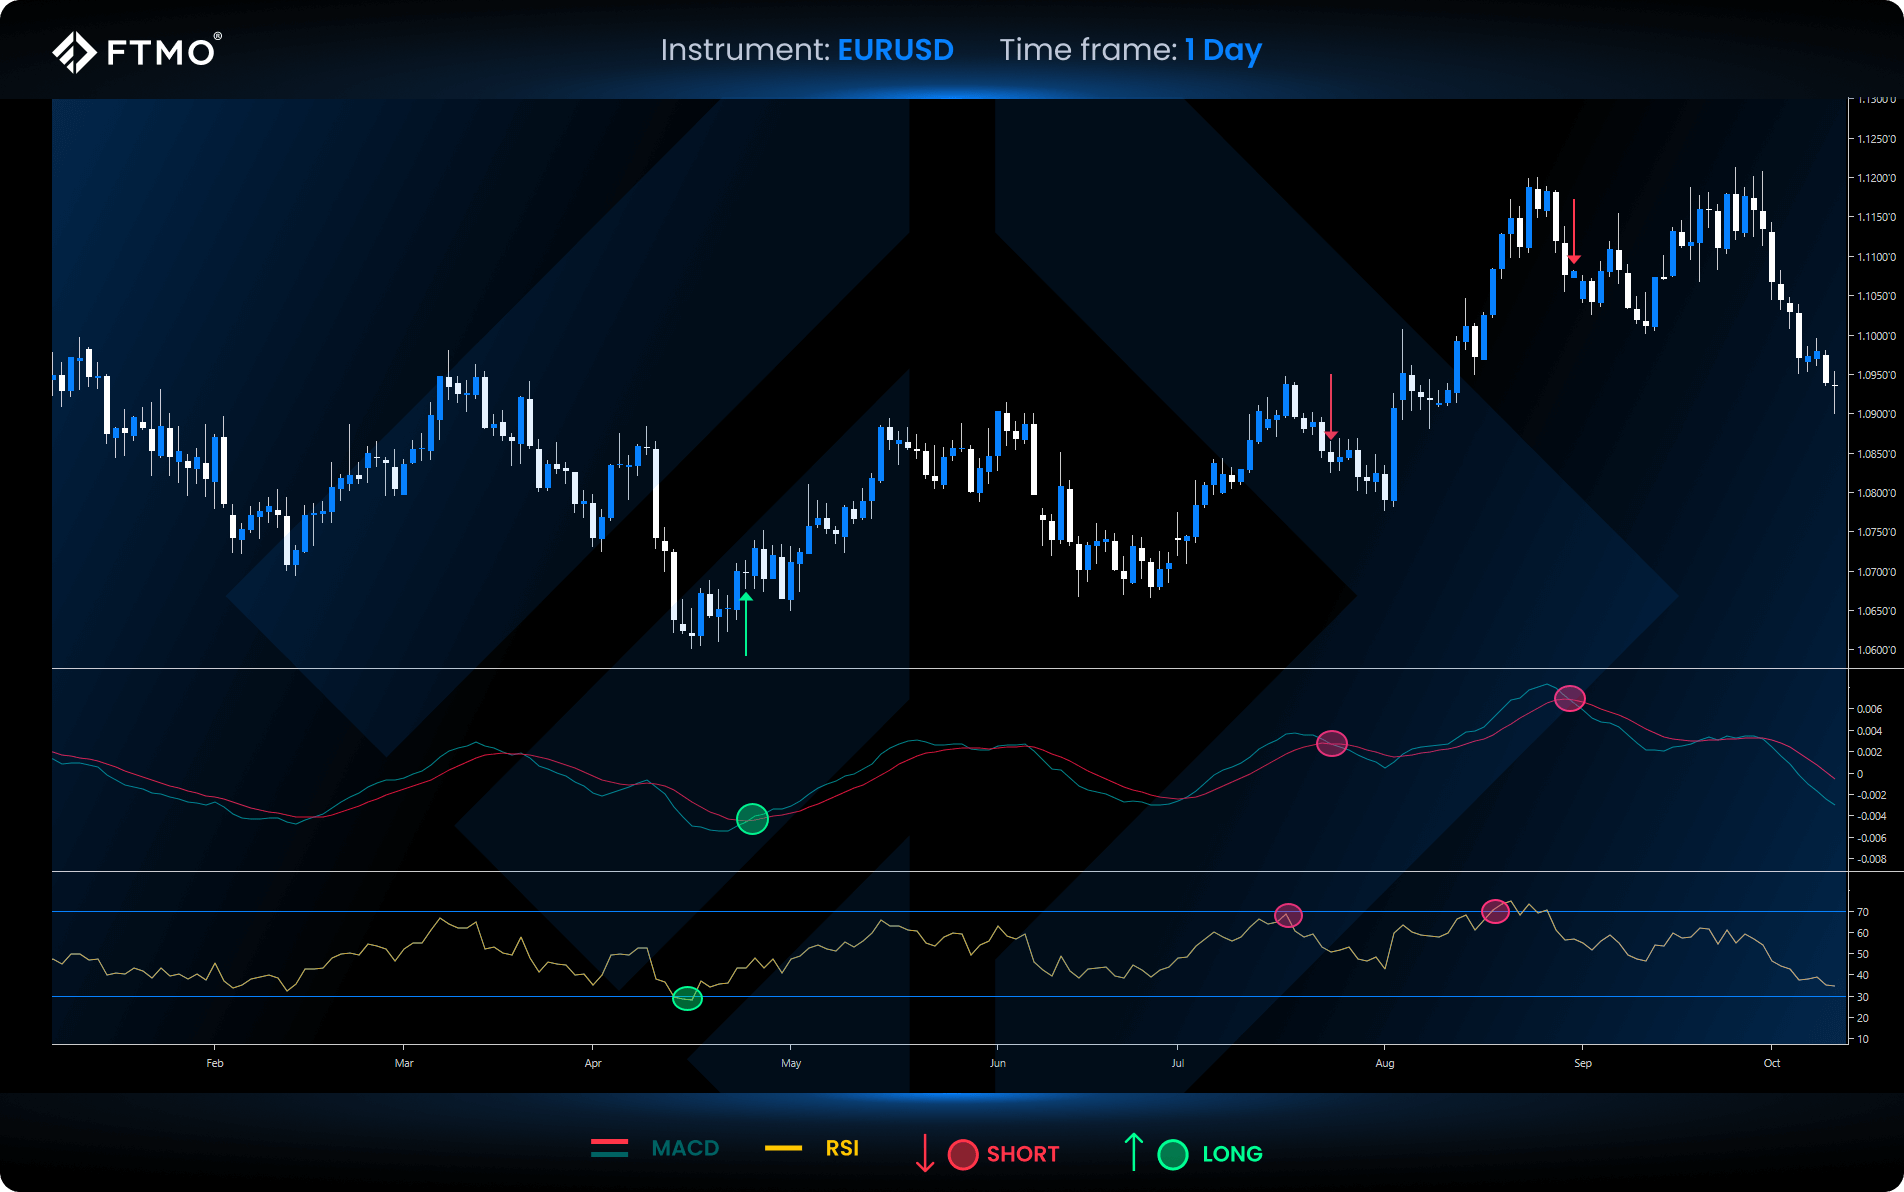
How to Use MACD with Bollinger Bands
In this strategy, MACD is used to enter the trade by waiting for a crossover on MACD if, at the same time, the price is located on one of the deviations, either the upper Bollinger or the lower Bollinger, which are used to determine the support and resistance.
Long signal: If the price is on the lower Bollinger band and at the same time the MACD line crosses the signal line, it is a signal to long.
Short signal: If the price is on the upper Bollinger band and the MACD line crosses from the top to the bottom signal line, it’s a sell signal.
Key Takeaways
- MACD identifies trend direction, strength, and momentum shifts by using EMAs.
- Combining MACD with other indicators increases accuracy and filters out false signals.
- Works across all timeframes, making it useful for day traders and long-term investors.
- The histogram visually shows momentum changes, helping traders spot early trend shifts.
