


Moving Average (MA): Technical Indicator
Ever wondered which Moving Average (MA) could boost your trading results? Discover how EMA, SMA or WMA can enhance your trading strategies.
What is a Moving Average (MA)?
A Moving Average (MA) is a popular technical indicator used by traders to identify market trends. It’s represented as a smooth line on a chart, calculated based on past price data. Traders commonly use three main types of moving averages: Simple Moving Average (SMA), Exponential Moving Average (EMA), and Weighted Moving Average (WMA).
Moving Average vs. Price Action
Moving Averages are lagging indicators reflecting price movements after they’ve occurred. While price action provides real-time signals directly from candles, moving averages simplify trend analysis, making them beginner-friendly.
What Does the Moving Average Indicator Reveal?
- Trend direction
Bullish trend: When the price is above the moving average, it indicates buyer dominance in the market.
Bearish trend: When the price is below the moving average, it signals that sellers control the market.
- Support and resistance levels
Moving averages can function as dynamic support when the price is trading above them or as dynamic resistance when the price is trading below.
- Entry and exit points
Traders use moving averages to identify entry signals or as reference points for setting stop-loss and take-profit levels. One common strategy is to watch for crossovers, such as when a short-term MA crosses above or below a longer-term MA.
Types of Moving Averages
Simple Moving Average (SMA)
The Simple Moving Average (SMA) is a type of moving average calculated by adding the closing prices over a specific period and dividing the total by the number of periods. It assigns equal weight to all prices within that period, both past and current.
- Formula: SMA = (A1 + A2 + … + An) / n
Exponential Moving Average (EMA)
The Exponential Moving Average (EMA) is calculated using the Simple Moving Average (SMA) as a starting point. Unlike the SMA, the EMA places greater emphasis on recent prices, making it particularly useful to traders due to its quicker response to current market information.
- Formula: EMA = (Current Price × (2 / (N + 1))) + (Previous EMA × (1 – (2 / (N + 1)))
Weighted Moving Average (WMA)
The Weighted Moving Average (WMA), like the EMA, places greater emphasis on recent prices by assigning them higher importance compared to older data. However, the WMA differs from the EMA in that it applies a simpler linear weighting method, making it less sensitive to recent price changes.
- Formula: WMA = [(Price₁ × n) + (Price₂ × (n – 1)) +… + Priceₙ] / [n × (n + 1) / 2]
Which Moving Average is Best for You?
EMA and WMA are often favoured due to their responsiveness to recent prices, aiding in timely trade decisions. However, EMA can generate false signals due to its sensitivity, whereas WMA might lag slightly behind EMA. Combining EMA and WMA can strengthen signal reliability.
Selecting the ideal moving average (MA) for your trading approach depends on several critical factors:
- Instrument volatility: Highly volatile assets often require more responsive (ie. ) moving averages to capture rapid price movements effectively.
- Trading timeframe: Short-term traders typically prefer more responsive moving averages, whereas long-term traders may benefit from smoother averages that highlight broader market trends.
- Trading style and strategy: Day traders might favour Exponential Moving Averages (EMA) or Weighted Moving Averages (WMA) because their greater sensitivity to recent price data allows for more timely trade entries and exits.
Recommended Moving Average Settings by Trading Style
Moving average settings for swing trading:
Traders often use 50-day, 100-day, or 200-day MAs.
Traders often employ 50-day, 100-day, or 200-day moving averages. A bullish signal arises when the 50-day MA is above the 200-day MA, whereas a bearish signal occurs when it falls below.
Moving average settings for day trading:
Shorter periods (5, 10, 20) are preferred for increased responsiveness.
The 20-day MA is especially popular for identifying intraday trends and dynamic support or resistance.
How to Use Moving Averages in Trading: Example of The EMA Crossover Strategy
In our case, we use the popular combination of the 200-day EMA, offering stable, long-term trend signals, and the 50-day EMA, which quickly adapts to market shifts. For day trading, switch to shorter EMAs—use the 50-day EMA instead of the 200-day EMA and the 20-day EMA instead of the 50-day EMA—to increase sensitivity to rapid market changes.
Long signal – also known as The Golden Cross
EMA 50 crossing EMA 200 from below to above.
Short signal – also known as The Death Cross
This occurs when the EMA 50 crosses the EMA 200 from above to below.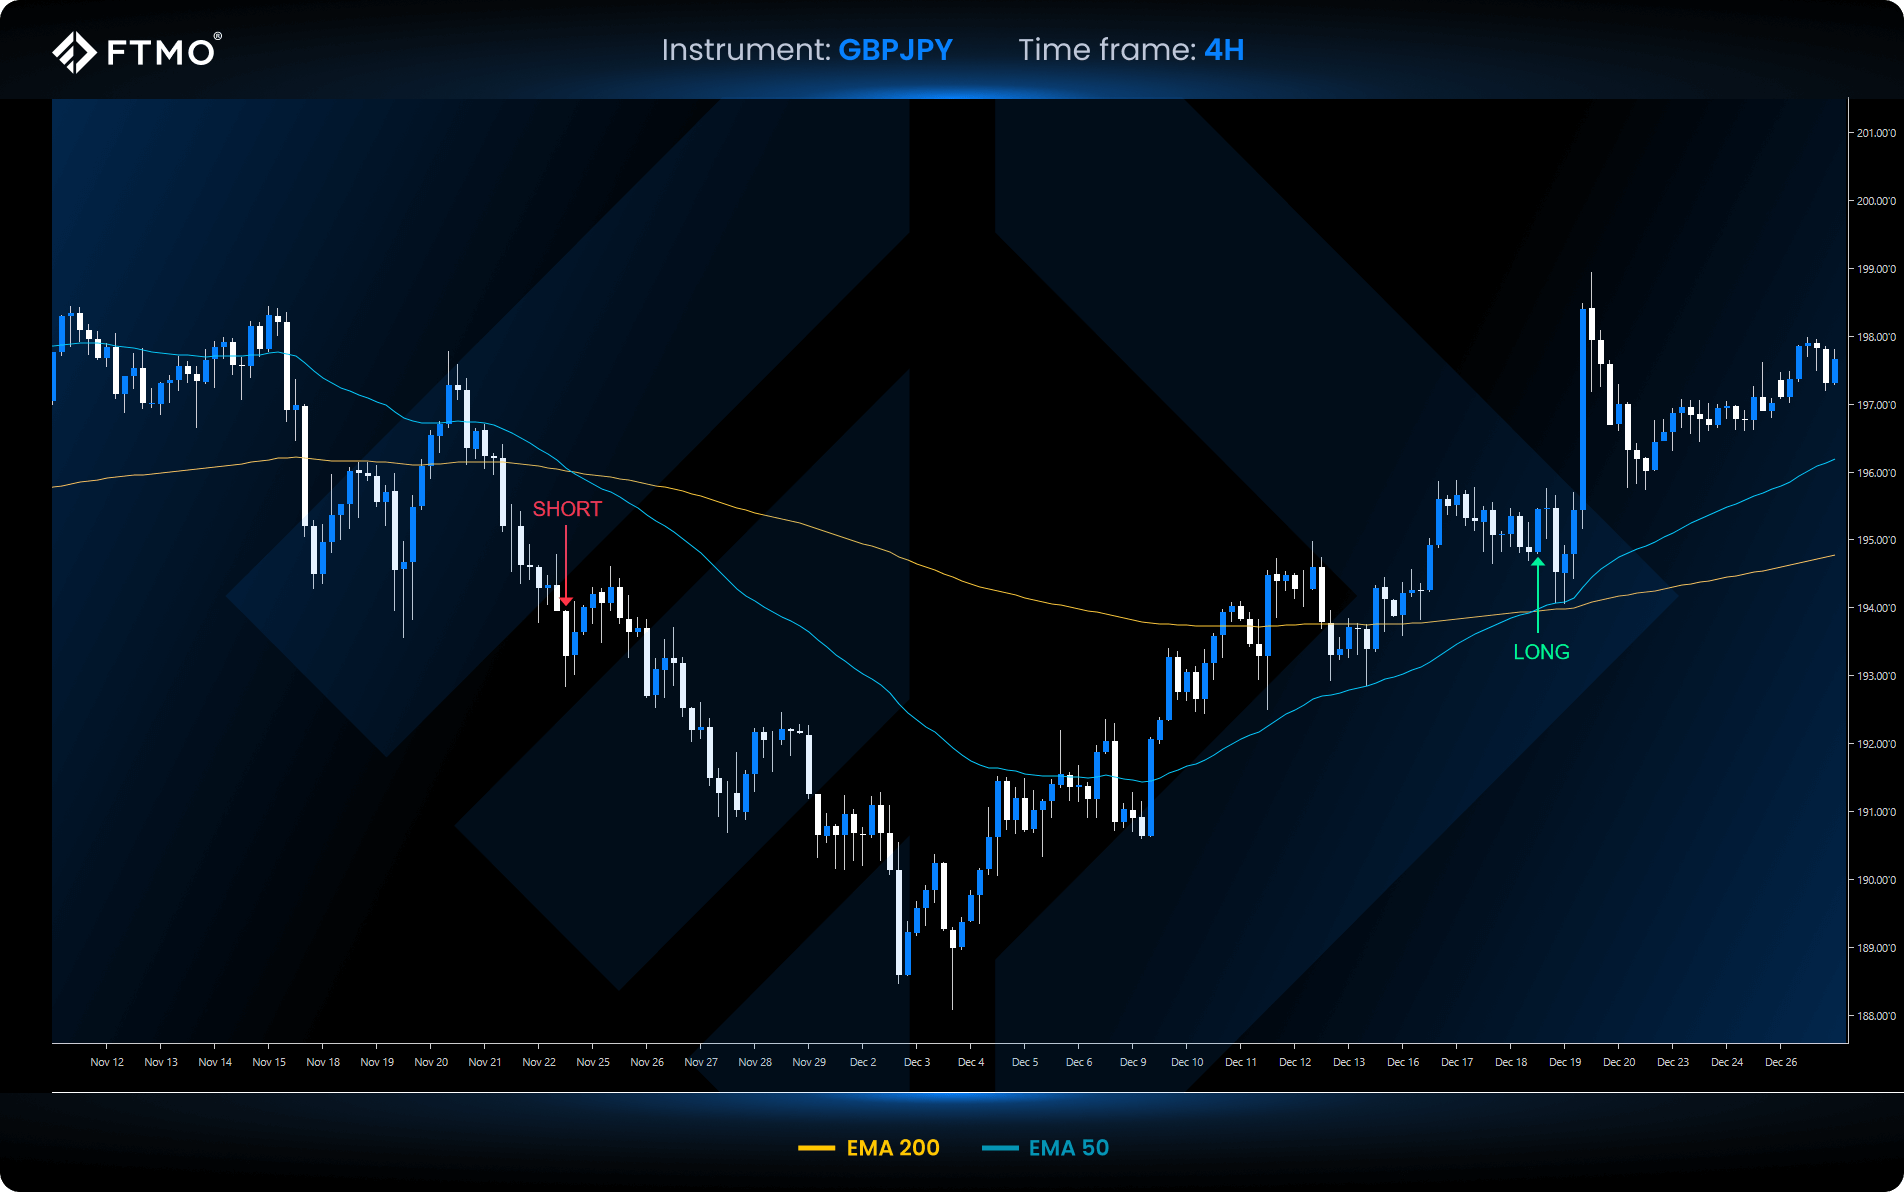
Key Takeaways
- Moving averages (MA) help traders identify market trends, determine trade directions, and function as dynamic support and resistance levels.
- The Exponential Moving Average (EMA) and Weighted Moving Average (WMA) respond more quickly to recent price movements, making them particularly useful for active traders, while the Simple Moving Average (SMA) equally weights historical data.
- Selecting the right MA type (EMA, SMA, WMA) and period depends on your trading style and market volatility.
Because MAs rely on past data, they can sometimes produce delayed or false signals. As a result, many traders combine them with additional technical indicators or techniques (e.g., RSI, price action analysis) to achieve more robust confirmation.
