


ATR: Technical Indicator
Have you ever struggled with market unpredictability and wondered how to effectively manage risk and volatility?
The Average True Range (ATR), developed by J. Welles Wilder Jr. in 1978, is a powerful technical analysis tool designed specifically to help traders navigate through the volatile markets.
What is the Average True Range?
The ATR is a technical indicator used primarily for measuring market volatility. Volatility is a key factor to consider when selecting appropriate trading strategies and markets. High volatility often leads to unpredictable price movements, whereas low volatility might limit potential profit opportunities. ATR helps traders quantify this volatility, leading to smarter decision-making.
How to Calculate ATR
ATR calculation involves two steps:
1. True Range (TR) Calculation
Current High – Current Low
Absolute Value of (Current High – Previous Close)
Absolute Value of (Current Low – Previous Close)
The highest of these values is the True Range.
2. ATR Calculation
ATR = [(Previous ATR × (n-1)) + Current True Range] ÷ n
Note: The period n is typically 14 days but can be adjusted:
- Short-term trading: 2-10 periods
- Long-term trading: 20-50 periods
Interpreting ATR Values
- High ATR
A high Average True Range value indicates increased market volatility and can be associated with trending markets. It can also signify possible trend reversal at a support or resistance level.
- Low ATR
Low ATR suggests a consolidation phase or possible start of a trend movement. Traders should be careful because when volatility is at its lowest points (depends on asset; every asset has a different range of volatility), there is usually a rapid spike in volatility after that, which can be devastating for many strategies.
How to Use ATR in Trading
1. Position Sizing
ATR assists in determining suitable position sizes based on market volatility:
Position Size = Risk Amount ÷ (ATR × Asset Price)
Adjusting positions based on ATR ensures risk remains manageable despite volatility fluctuations.
2. Stop-loss Placement
ATR helps establish dynamic stop-losses:
- Long position: Entry price – (ATR × Multiplier)
- Short position: Entry price + (ATR × Multiplier)
Multipliers typically range between 1.5 and 3, adjusted based on risk preference.
3. Breakout Confirmation
Using ATR, we can better identify a possible breakout. The breakout formation is often followed by increased volatility. Therefore, it is a great idea to look for higher ATR (high volatility) values on support or resistance levels, which can confirm breakouts.
4. Support and Resistance
Unlike traditional static support and resistance levels, ATR-based support and resistance adapt dynamically to volatility changes:
- ATR High Level (Resistance): Closing Price + ATR
Crosses above this indicate bullish strength. - ATR Low Level (Support): Closing Price – ATR
Moves below this suggest bearish momentum.
ATR Trading Strategy
This strategy uses ATR to set support (ATR Low) and resistance (ATR High). Entry and stop-loss signals follow the Fair Value Gap (FVG) method. A Fair Value Gap (FVG) is a price imbalance formed when the market moves quickly, leaving a gap between candle wicks. Traders anticipate these gaps will later fill, signalling potential trade entries.
Defined Strategy Rules
Short setup example:
1. Price touches/crosses ATR High without fully closing above.
2. Identify bearish FVG (middle candle bearish).
3. Enter short at the nearest edge; stop-loss at gap candle high.
4. Target profit set at 1:2 RRR.
Long setup example:
1. Price touches/crosses ATR Low without fully closing below.
2. Identify bullish FVG (middle candle bullish).
3. Enter long at the nearest edge; stop-loss at gap candle low.
4. Target profit set at 1:2 RRR.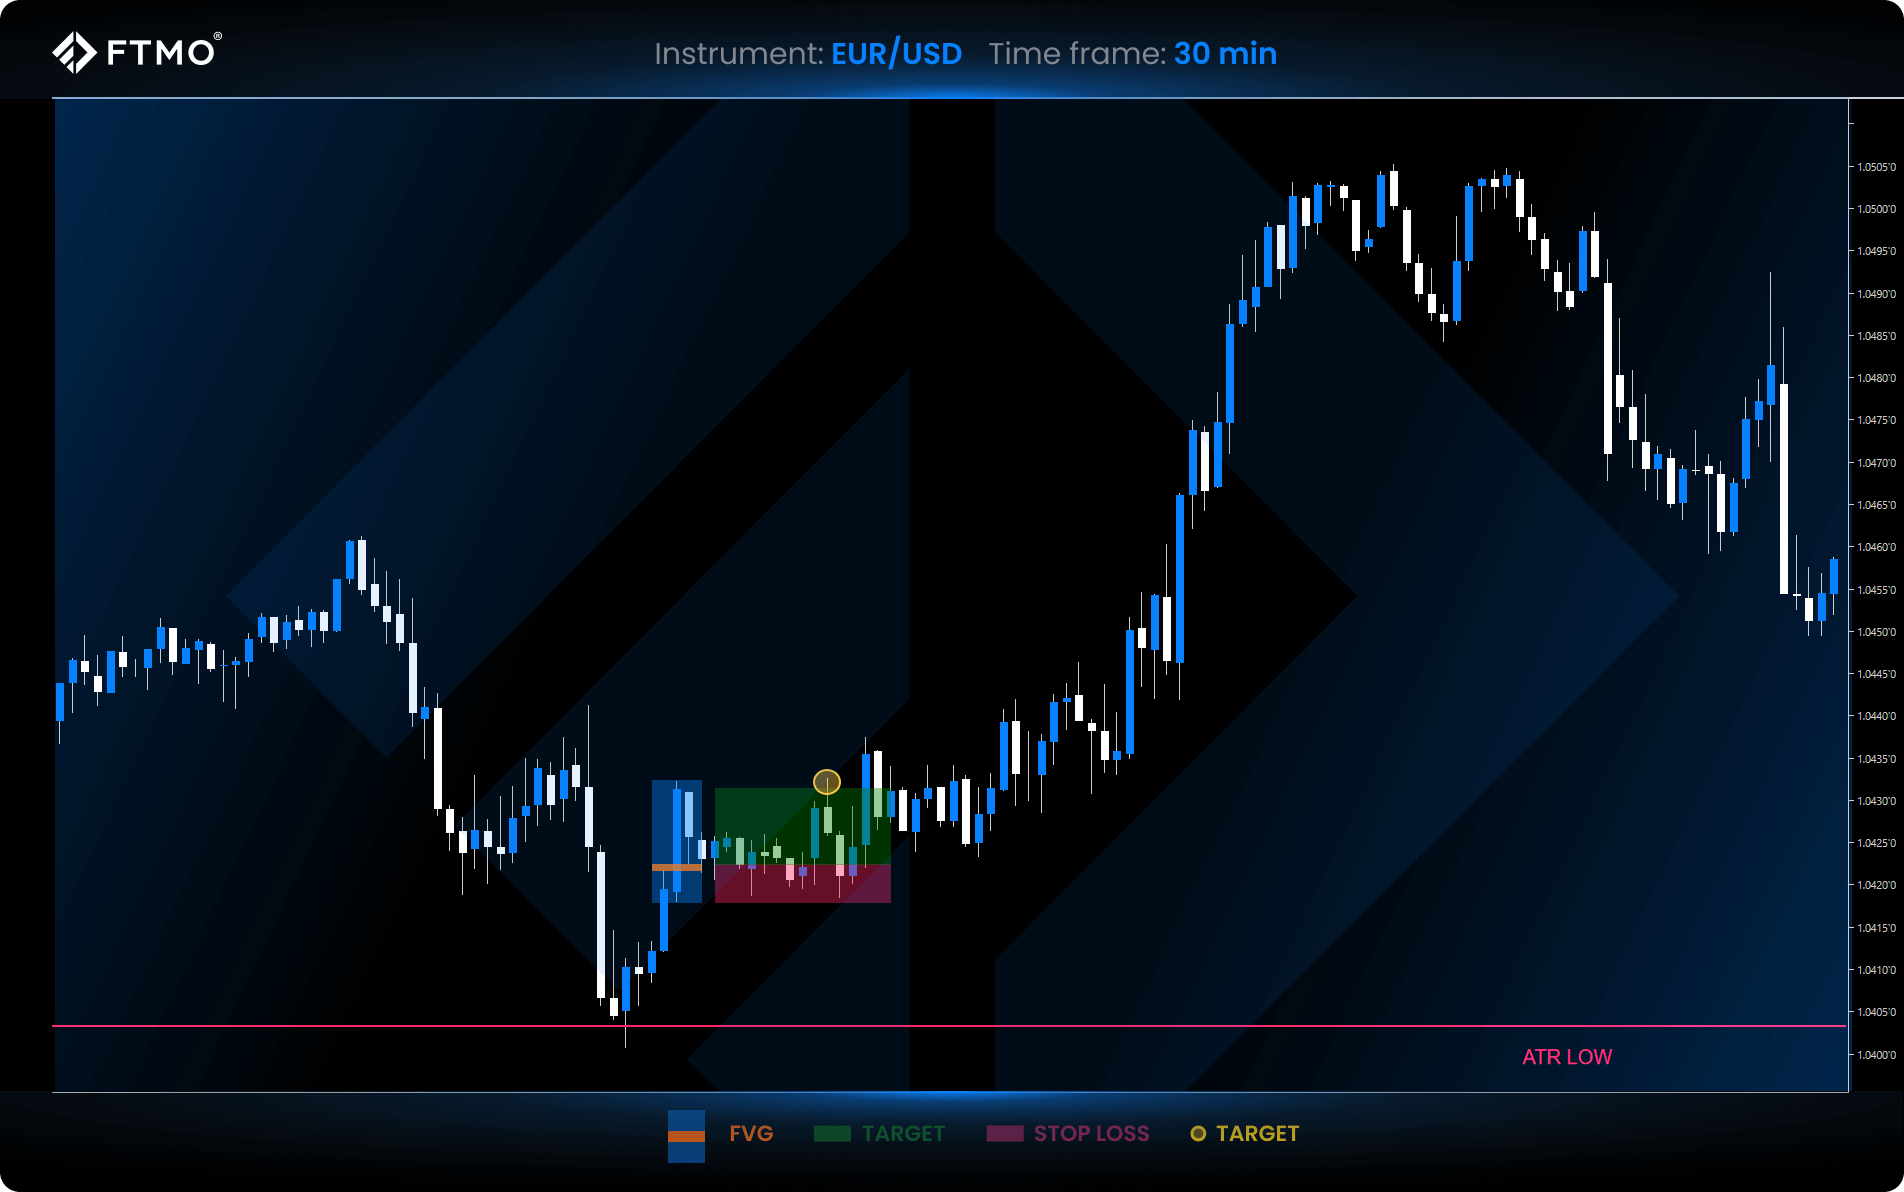
Limitations and Benefits of ATR
Limitations
- Lagging indicator
ATR is based on historical data and does not predict future price movements.
- Lack of context
The effectiveness of trading strategies that incorporate ATR may be reduced if market context is not considered.
- Requires other indicators or price action
ATR serves only as assistance for confirmation of a breakout or as support and resistance. For trading, it is necessary to use another indicator for position entries.
- Does not indicate trend direction
It doesn’t show us the exact direction of the trend, only its possible beginning or end.
Benefits
- Good tool for risk management
ATR can be used to determine position size and stop loss based on asset volatility.
- Breakout and trend confirmations
The magnitude of volatility helps us to verify potential breakouts and trends.
- Works across all timeframes
The ATR indicator can be used on all timeframes, but the period setting must be adjusted accordingly.
Key takeaways
- ATR Measures Volatility
ATR (Average True Range) quantifies market volatility, enabling better risk management and informed trading decisions. - Practical Trading Applications
ATR is valuable for adjusting position sizes, setting dynamic stop-loss levels, confirming breakout signals, and establishing adaptive support/resistance zones. - Effective but Limited
ATR provides essential insights into market conditions but doesn’t indicate trend direction or future movements and should be combined with additional indicators or price action strategies.
