


RSI: Technical Indicator
Want to know exactly when to enter or exit your trades? The Relative Strength Index (RSI) helps traders pinpoint the perfect moment for trading reversals. Created by J. Welles Wilder in 1978, RSI quickly became one of the most popular technical indicators due to its simplicity and effectiveness across all trading timeframes.
What is the Relative Strength Index (RSI)?
RSI is a momentum oscillator used in technical analysis to measure overbought and oversold market conditions. It compares the magnitude and speed of recent price changes to identify potential price reversals or trend continuations.
RSI Formula and Calculation Explained
The Relative Strength Index (RSI) is calculated using the following formula:
RSI(n) = 100 – [100 / (1 + U(n) / D(n))]
Where:
- U(n) represents the average gain over the selected number of periods.
- D(n) represents the average decline over the same number of periods.
How to Calculate U(n) and D(n)
To calculate D(n), sum all the declines over the selected period (commonly 14 periods) and divide by that number of periods. Similarly, U(n) is calculated by adding up all the gains over the same period and dividing by the number of periods.
This calculation gives a clear measure of market strength by comparing average gains and declines, making the RSI a useful tool for analysing market momentum.
How RSI works?
RSI measures the momentum of price movements, identifying whether an asset is potentially overbought (above 70) or oversold (below 30). The indicator oscillates between 0 and 100, clearly visualising market conditions.
RSI Key Value Ranges
- RSI below 30: If the RSI shows a value of 30 or less on its scale, the market might be in an oversold condition, meaning a dominance of sellers in the market, which can lead to the absorption or exhaustion of sellers, and in both cases, it is a buy signal. You can spot this on the chart in the form of a structure change to long.
- RSI between 30 and 70: This is also called the neutral zone, where the market is neither overbought or oversold. Traders may interpret this range as a zone of consolidation or indecision in the market, waiting for a clear trend to emerge before making a trading decision.
- RSI above 70: At the value of 70, the RSI indicates an overbought condition and could possibly reverse.
What is the Best Setting for RSI?
There is no best RSI setting, but an important factor in choosing one is your trading style. Different trading styles require different types of settings, and here are some of the most commonly used:
- Day trading: 10-14 periods, lines 80 for overbought and 20 for oversold
- Swing trading: 14 periods, 70 overbought, and 30 oversold
- Scalping: 5-7 periods, 90 overbought, and 10 oversold
How to Use RSI in Trading
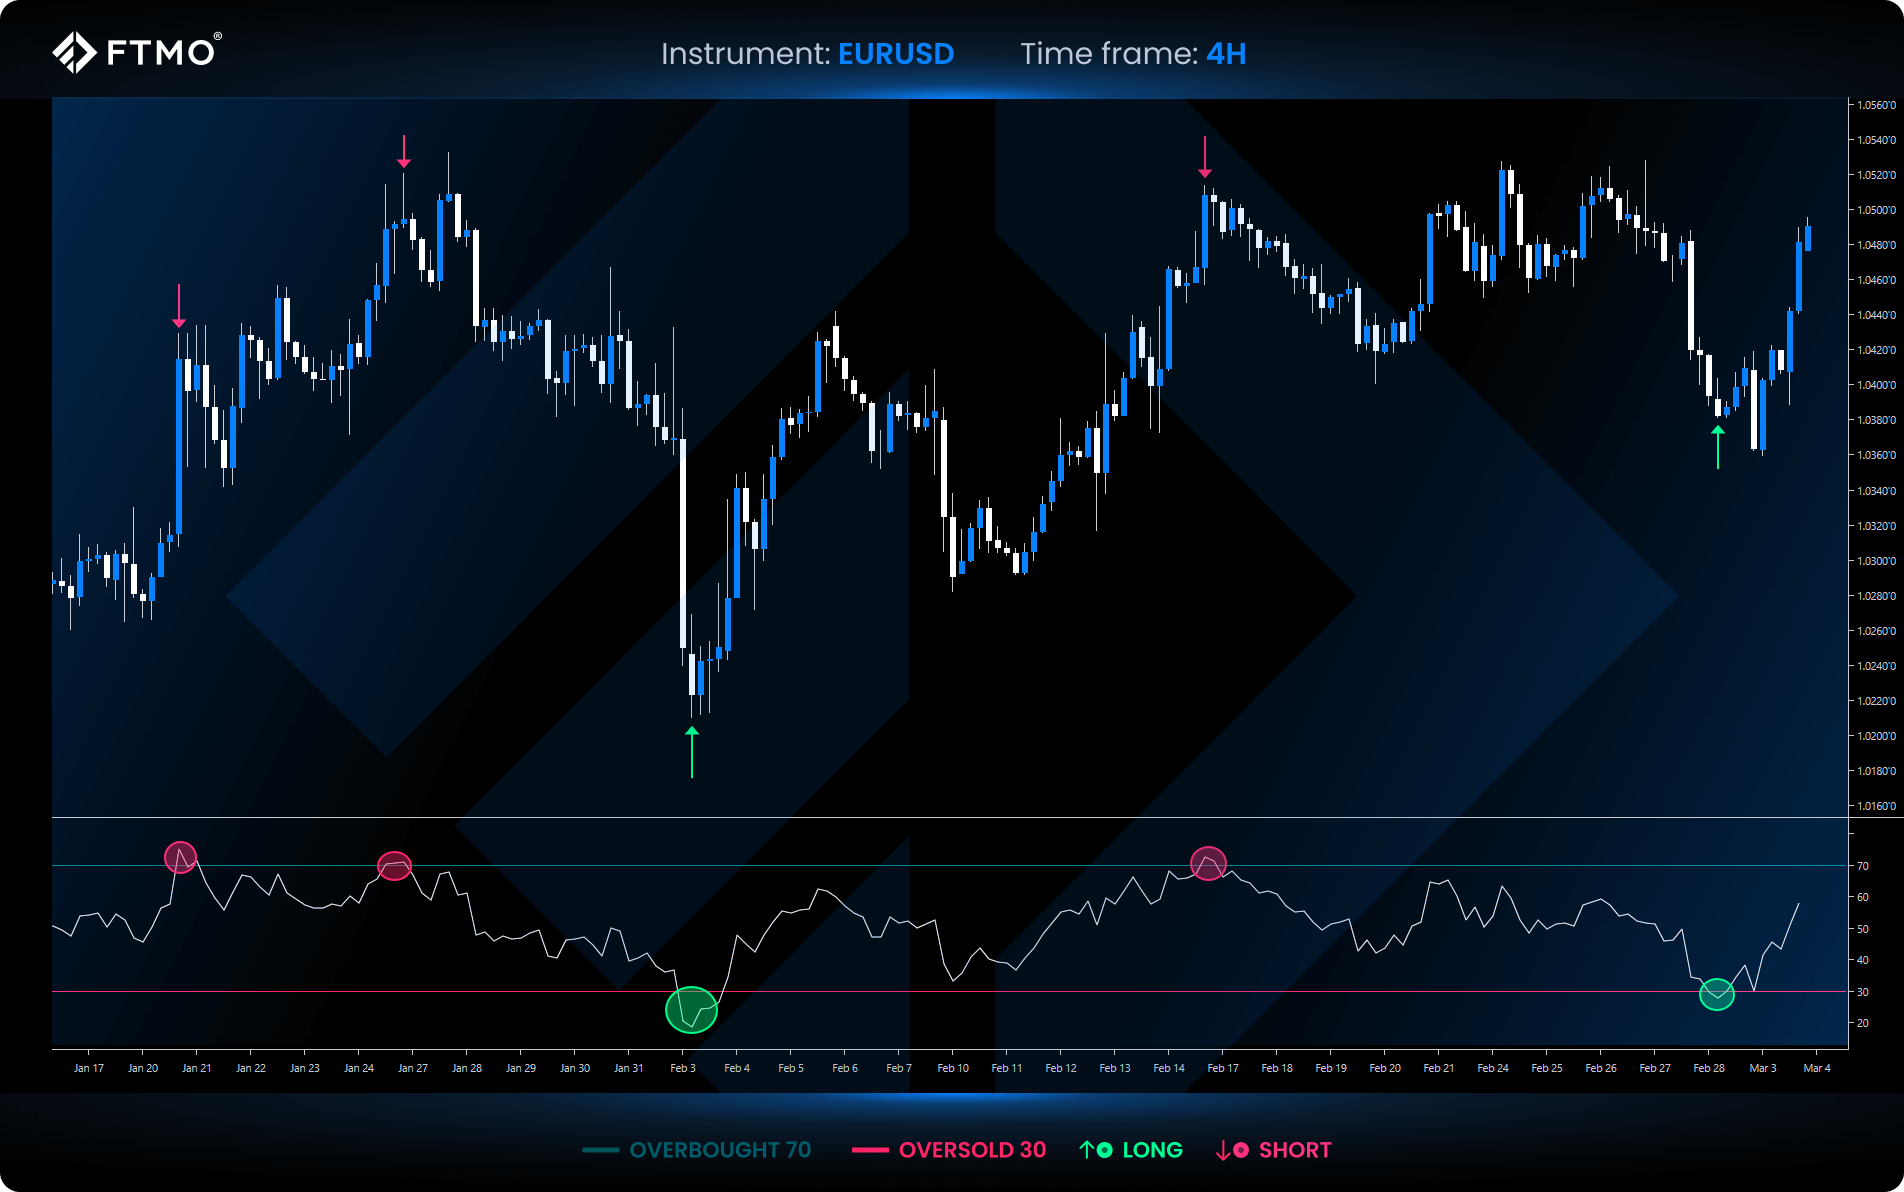
RSI as a buy and sell indicator
This is the easiest way to implement RSI into your strategy. This method is based on monitoring the RSI level, which shows us overbought and oversold conditions specifically at 30 and 70. It works well as a confirmation on entries or to determine trade directions, but it should not be used as a standalone technical analysis tool due to its inaccuracy. Enhance your win rate by experimenting with additional indicators such as VWAP or MACD, or by combining them with other tools like Fibonacci levels, market structure, and others in conjunction with the Relative Strength Index.
RSI buy signal example
Enter the trade if the RSI hits or falls below the 30 level.
RSI sell signal example
Same as with a buy signal, wait for it to hit 70, or if it gets below 70.
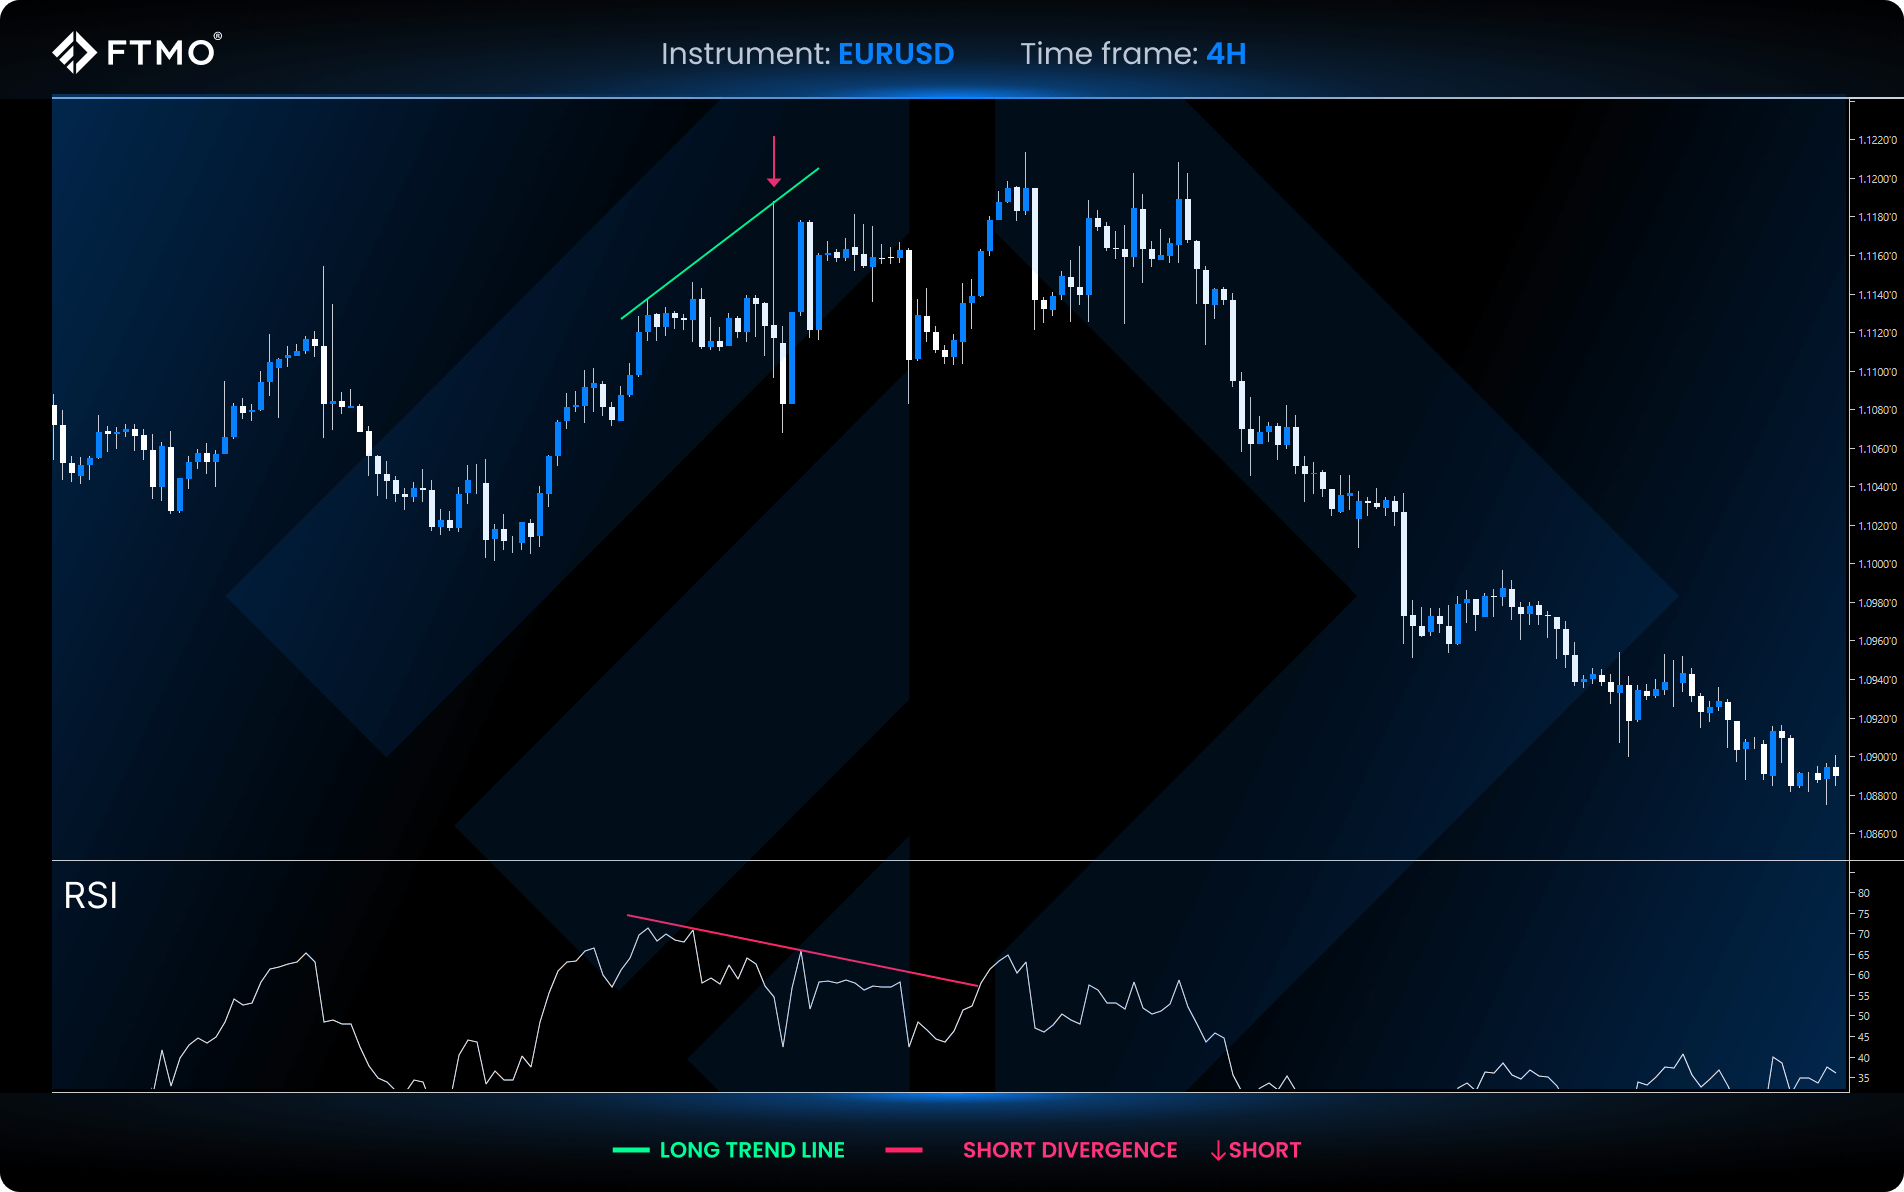
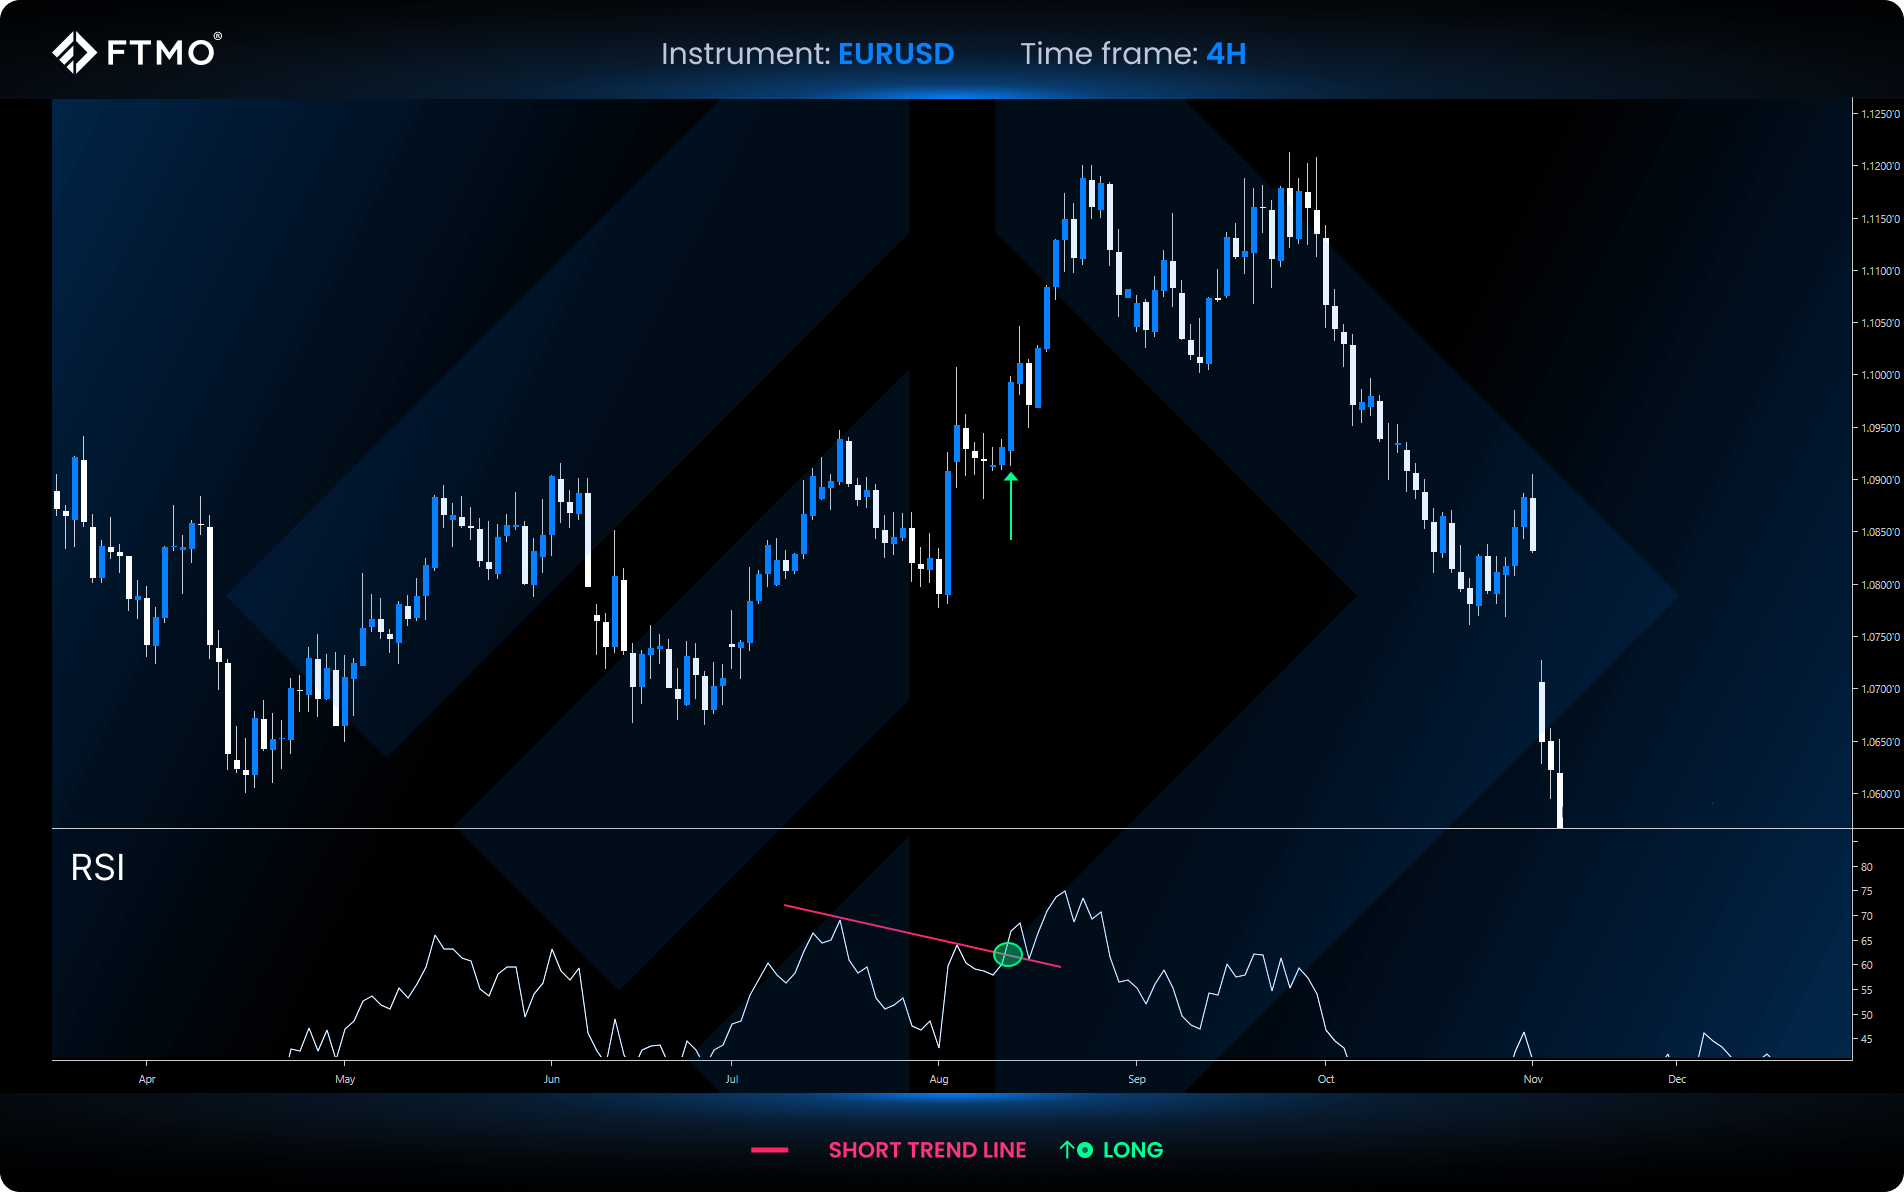
How to trade RSI divergence
The use of divergence is also very popular among traders. It is based on the comparison of price and RSI development. If the price is rising and reaching new highs and the RSI is falling, this could signal the beginning of a downward trend, known as bearish divergence. Conversely, bullish divergence occurs when the price decreases but the RSI increases, signalling a potential price increase. We can use divergence to determine the trend direction or trade entries.
Buy signal example
When a bullish divergence is formed and subsequently the price chart starts going in the same direction as the RSI, it is an entry signal.
Sell signal example
After a bearish divergence, we wait for the confluence of both the RSI and price action charts and then enter the trade.
RSI trend line break
The use of the break trend line is very simple. It is a combination of the RSI indicator and a simple but useful technical analysis tool: a trend line that is used as support or resistance for trend movements, and its breaking can indicate the end of the trend and a change in direction. The probability of a valid signal increases with the number of touches of the trend line.
Buy signal example
If there is a breakout of 2 or more lower highs on the RSI to the upper side, this is a signal to take a long position.
Short signal example
In the case of a short, 2 or more higher highs must form on the RSI, and a following breakout to the lower side signals a short.
Limitations and risks of RSI
- RSI in strong trends
RSI works better in some market conditions than in others. This indicator just excels in less volatile markets where its signals are more accurate, then in high volatility with economic news or strong trends, it has a problem with precision and often tends to be at the extreme values.
- No volume included
Another disadvantage is that it is also not based on the volume of trades, which is a key factor in technical analysis where it helps traders to see support and resistance zones.
- Lack of context
RSI is very difficult to use without using other technical analysis tools because the indicator tends to produce false signals when market conditions change. Thus, it is advisable not to rely solely on RSI but to use it as a complementary tool in your overall trading strategy.
Key Takeaways
- The relative strength index is a popular technical indicator among traders.
- RSI was developed by J. Welles Wilder and is a versatile tool applicable across all timeframes and known for its simplicity.
- It ranges on a scale of 0-100 and has two significant zones, namely 70, which indicates an overbought condition, and 30, which indicates an oversold condition of a given market.
- The use of this indicator can be different, for example, to determine entries or trade directions and possible reversals.
- Despite its strengths, RSI has its weaknesses, especially when trading in highly volatile markets, where the indicator produces an increased amount of false signals and often goes to extremes, but the trend can continue. Therefore, it is advisable to consider using other technical tools in addition to RSI.
- Traders should view RSI as a supporting component rather than the sole basis of their strategies.
